
MATLAB: An Introduction with Applications
6th Edition
ISBN: 9781119256830
Author: Amos Gilat
Publisher: John Wiley & Sons Inc
expand_more
expand_more
format_list_bulleted
Related questions
Concept explainers
Topic Video
Question
thumb_up100%
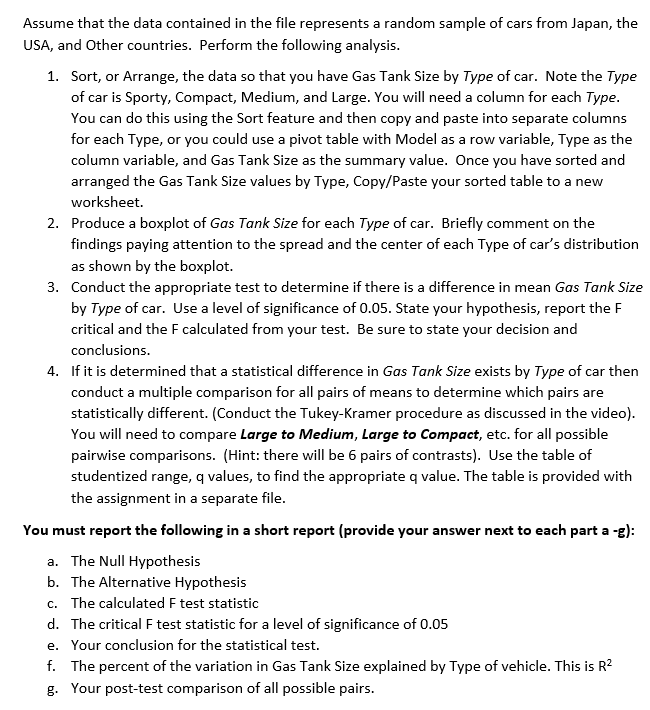

Transcribed Image Text:Assume that the data contained in the file represents a random sample of cars from Japan, the
USA, and Other countries. Perform the following analysis.
1. Sort, or Arrange, the data so that you have Gas Tank Size by Type of car. Note the Type
of car is Sporty, Compact, Medium, and Large. You will need a column for each Type.
You can do this using the Sort feature and then copy and paste into separate columns
for each Type, or you could use a pivot table with Model as a row variable, Type as the
column variable, and Gas Tank Size as the summary value. Once you have sorted and
arranged the Gas Tank Size values by Type, Copy/Paste your sorted table to a new
worksheet.
2. Produce a boxplot of Gas Tank Size for each Type of car. Briefly comment on the
findings paying attention to the spread and the center of each Type of car's distribution
as shown by the boxplot.
3. Conduct the appropriate test to determine if there is a difference in mean Gas Tank Size
by Type of car. Use a level of significance of 0.05. State your hypothesis, report the F
critical and the Fcalculated from your test. Be sure to state your decision and
conclusions.
4. If it is determined that a statistical difference in Gas Tank Size exists by Type of car then
conduct a multiple comparison for all pairs of means to determine which pairs are
statistically different. (Conduct the Tukey-Kramer procedure as discussed in the video).
You will need to compare Large to Medium, Large to Compact, etc. for all possible
pairwise comparisons. (Hint: there will be 6 pairs of contrasts). Use the table of
studentized range, q values, to find the appropriate q value. The table is provided with
the assignment in a separate file.
You must report the following in a short report (provide your answer next to each part a -g):
a. The Null Hypothesis
b. The Alternative Hypothesis
c. The calculated F test statistic
d. The critical F test statistic for a level of significance of 0.05
e. Your conclusion for the statistical test.
f. The percent of the variation in Gas Tank Size explained by Type of vehicle. This is R?
g. Your post-test comparison of all possible pairs.

Transcribed Image Text:Summary
Compact
Large
Medium Sporty
2790
3350
3265
3110
2895
3325
2935
3320
2640
4285
3640
3280
2655
3545
2880
2885
2485
4025
3465
2935
3065
3855
3480
2780
2670
3630
3195
2850
2750
3735
3570
3310
2920
3665
2975
2695
2780
3850
3450
2870
3020
4040
3080
2455
2745
3735
3145
2170
3110
3415
3015
2710
2920
3185
3190
2210
2645
3690
3610
2690
2575
3460
2885
2775
2775
4000
3350
2995
3930
2390
2935
3695
2900
2920
3780
2885
2985
3480
3470
3315
2680
3200
2270
3220
2765
3000
3065
3295
3480
3140
Expert Solution
This question has been solved!
Explore an expertly crafted, step-by-step solution for a thorough understanding of key concepts.

This is a popular solution

Trending nowThis is a popular solution!

Step by stepSolved in 2 steps with 4 images

Knowledge Booster


Learn more about
Need a deep-dive on the concept behind this application? Look no further. Learn more about this topic, statistics and related others by exploring similar questions and additional content below.Similar questions
- his K You are testing the null hypothesis that there is no linear relationship between two variables, X and Y. From your sample of n = 18, you determine that b₁ = 4.3 and Sb₁ = 1.4. a. What is the value of tSTAT? b. At the a=0.05 level of significance, what are the critical values? c. Based on your answers to (a) and (b), what statistical decision should you make? d. Construct a 95% confidence interval estimate of the population slope, B₁. e to search a. What are the hypotheses to test? A. Ho: B₁ = 0 H₁: B₁ #0 © C. Ho: P₁20 H₁: B₁ O OD. Ho: B₁ #0 H₁: B₁ = 0 fg 144 f10 84°F ^ @ fil *** 6464 Clear all h12 mportant Information ce Identification Cards. Two cards have been cle insured. Please destroy your old cards ecome effective. A law enforcement officer South Carolina law. The Insurance rovide this proof. that you have liability insurance meeting ons on the ID Card, only the are listed. For a full list of ease reference the Dri (page 7). omptly of any portant policarrow_forward2.18 2.42 2.57 2.89 Suppose the data represent the inches of rainfall in April for a certain city over the course of 20 years. 4.79 D 0.53 0.76 1.23 1.37 1.86 3.37 3.66 3.88 4.09 4.49 5.04 5.36 5.79 Given the quartiles Q, = 2.020, Q, = 3.280, and Q3 = 4.640, compute the interquartile range, IQR. 3.19 6.08 IQR =D (Round to three decimal places as needed.)arrow_forwardWhen the distance from the smallest observation to the 1st quartile is much greater than the distance from the 3rd quartile to the largest observation, the data set is most likely Two answers correct. 1. symmetrical. 2. nonsymmetrical. 3. skewed to the right. 4. skewed to the left. 5. not skewed.arrow_forward
- You wish to test the claim that the first population mean is not equal to the second population mean at a significance level of α=0.02 . Ho:μ1=μ2 Ha:μ1≠μ2 You obtain the following two samples of data. Sample #1 Sample #2 67.1 64.2 32.7 49.0 63.8 54.8 63.5 54.1 65.6 54.8 40.5 58.7 39.4 43.1 72.5 73.1 70.2 71.2 68.1 73.1 79.7 67.3 66.5 61.7 62.9 76.5 What is the test statistic for this sample?test statistic = Round to 3 decimal places. What is the p-value for this sample?p-value = Use Technology Round to 4 decimal places. The p-value is... less than (or equal to) α greater than α This test statistic leads to a decision to... reject the null accept the null fail to reject the null As such, the final conclusion is that... There is sufficient evidence to warrant rejection of the claim that the first population mean is not equal to the second population mean. There is not sufficient…arrow_forwardeconometricsarrow_forwardYou wish to test the following claim (Ha) at a significance level of a = 0.01. H₂:μ₁ = μ₂ Ha:μι > με You obtain the following two samples of data. Sample #1 Sample #2 60 50.1 91.5 89.8 56 44.8 85.6 93.4 58.4 83.8 106.9 73.9 44.8 78.1 70.8 37.7 63.5 82.7 71.7 34.7 90.6 67.7 66.8 61.6 65 65.9 77.6 61.1 111.7 106.9 51.8 88.3 69 80.5 78.1 62.6 99.7 64.5 67.2 52.6 71.2 75.3 76.2 96.8 70.8 49.2 46.1 111.7 51.8 The p-value is... mlm What is the test statistic for this sample? (Report answer accurate to three decimal places.) test statistic = 66.2 63.3 60 63.1 61.3 75 62.3 63.3 69.4 57.9 71.2 68.4 74.7 70.6 65.1 68.5 75.8 78.4 73.1 58.6 59.1 66 71.5 67.2 67.3 69 70.9 68.9 73.1 64.4 66.9 71.2 65.6 68.7 60.7 65.3 76.3 74.7 70.1 65.6 59.6 68.2 67.2 69.7 68.9 65.4 66.2 65.6 65.1 62.5 0.7 60.4 68.9 76.8 65.6 76.3 64.7 55.6 71.7 69.7 64.2 72.9 What is the p-value for this sample? For this calculation, use the degrees of freedom reported from the technology you are using. (Report answer accurate to…arrow_forward
- Using an a = 0.05 significance level, what was the evidence for your answer to the previous question? O Because the p-value of the t-test for Experience is greater than 0.05, the analyst should not reject Ho: B₁ 0 so HA B10 is unsupported. This means that there is NO statistically significant relationship between Sales and Experience. = Because the p-value of the t-test for the Intercept is less than or equal to 0.05, the analyst should reject Ho: Bo 0 and accept HA Bo 0. This means that there is a statistically significant relationship between Sales and Experience. - O Because the p-value of the t-test for Experience is less than or equal to 0.05, the analyst should reject Ho: B1 = 0 and accept HA B1 0. This means that there is a statistically significant relationship between Sales and Experience. : O Because the p-value of the t-test for Experience is less than or equal to 0.05, the analyst should reject Ho: B1 = 0 and accept HA B1 0. This means that there is NO statistically…arrow_forwardYou're fired! ~ Suppose that in a random sample of 252 employed Americans, there are 38 individuals who say that they would fire their boss if they could. Round all calculated values in this problem to 4 decimal places. 1. The value 38/252 = 0.1508 is a Statistic We want to use the information from the sample to conduct a hypothesis test to determine if fewer than 19% of employed Americans would fire their boss if they could. 2. Choose the null and alternative hypotheses for this test. Use appropriate notation. ОА. Но : р %3D 0.19, На : р 0.19 A 3. If you assume that the observations in the sample are independent, what is the smallest value the sample size could be to meet the conditions for this hypothesis test? А. 38 В. 10 С. 20 D. 67 ОЕ. 53 OF. None of the abovearrow_forwardAnswer the following to summarize the test of the hypothesis that there is no dependence between the two variables color vision of participant and trial outcome. For your test, use the 0.05 level of significance. a. Find the value of the test statistic. (Round to two or more decimal places.) b. Find the critical value for a test at the 0.05 level of significance. (Round to two or more decimal places.) c. Can we reject the hypothesis that there is no dependence between the variables color vision of participant and trial outcome? Use the 0.05 level of significance.arrow_forward
arrow_back_ios
arrow_forward_ios
Recommended textbooks for you
- MATLAB: An Introduction with ApplicationsStatisticsISBN:9781119256830Author:Amos GilatPublisher:John Wiley & Sons Inc
 Probability and Statistics for Engineering and th...StatisticsISBN:9781305251809Author:Jay L. DevorePublisher:Cengage Learning
 Statistics for The Behavioral Sciences (MindTap C...StatisticsISBN:9781305504912Author:Frederick J Gravetter, Larry B. WallnauPublisher:Cengage Learning
  Elementary Statistics: Picturing the World (7th E...StatisticsISBN:9780134683416Author:Ron Larson, Betsy FarberPublisher:PEARSON
 The Basic Practice of StatisticsStatisticsISBN:9781319042578Author:David S. Moore, William I. Notz, Michael A. FlignerPublisher:W. H. Freeman
 Introduction to the Practice of StatisticsStatisticsISBN:9781319013387Author:David S. Moore, George P. McCabe, Bruce A. CraigPublisher:W. H. Freeman
MATLAB: An Introduction with Applications
Statistics
ISBN:9781119256830
Author:Amos Gilat
Publisher:John Wiley & Sons Inc
Probability and Statistics for Engineering and th...
Statistics
ISBN:9781305251809
Author:Jay L. Devore
Publisher:Cengage Learning
Statistics for The Behavioral Sciences (MindTap C...
Statistics
ISBN:9781305504912
Author:Frederick J Gravetter, Larry B. Wallnau
Publisher:Cengage Learning
Elementary Statistics: Picturing the World (7th E...
Statistics
ISBN:9780134683416
Author:Ron Larson, Betsy Farber
Publisher:PEARSON
The Basic Practice of Statistics
Statistics
ISBN:9781319042578
Author:David S. Moore, William I. Notz, Michael A. Fligner
Publisher:W. H. Freeman
Introduction to the Practice of Statistics
Statistics
ISBN:9781319013387
Author:David S. Moore, George P. McCabe, Bruce A. Craig
Publisher:W. H. Freeman