FINANCIAL ACCOUNTING
10th Edition
ISBN: 9781259964947
Author: Libby
Publisher: MCG
expand_more
expand_more
format_list_bulleted
Concept explainers
Topic Video
Question

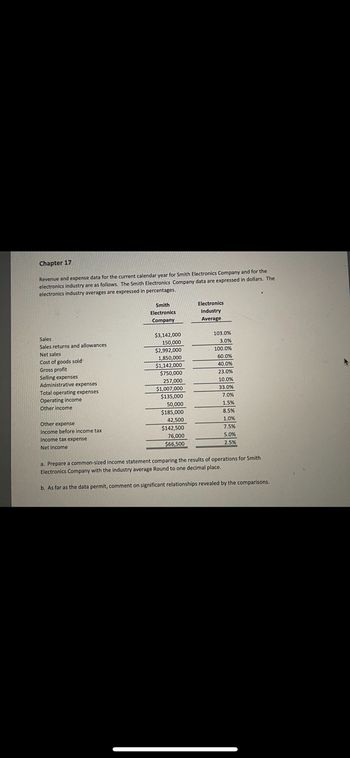
Transcribed Image Text:### Chapter 17
Revenue and expense data for the current calendar year for Smith Electronics Company and for the electronics industry are as follows. The Smith Electronics Company data are expressed in dollars. The electronics industry averages are expressed in percentages.
#### Smith Electronics Company Financial Data
| **Category** | **Smith Electronics Company** | **Electronics Industry Average** |
|---------------------------------|-------------------------------|---------------------------------|
| **Sales** | $3,142,000 | 103.0% |
| **Sales returns and allowances**| $150,000 | 100.0% |
| **Net sales** | $2,992,000 | 98.0% |
| **Cost of goods sold** | $1,850,000 | 60.0% |
| **Gross profit** | $1,142,000 | 40.0% |
| **Selling expenses** | $750,000 | 25.0% |
| **Administrative expenses** | $257,000 | 33.0% |
| **Total operating expenses** | $1,007,000 | 33.0% |
| **Operating income** | $135,000 | 7.0% |
| **Other income** | $150,000 | 1.5% |
| **Other expense** | $158,000 | 8.5% |
| **Income before income tax** | $142,500 | 7.5% |
| **Income tax expense** | $76,000 | 5.0% |
| **Net income** | $66,500 | 2.5% |
#### Tasks
**a.** Prepare a common-sized income statement comparing the results of operations for Smith Electronics Company with the industry average. Round to one decimal place.
**b.** As far as the data permit, comment on significant relationships revealed by the comparisons.
The data presented offer insights into how Smith Electronics Company compares to industry averages across key financial metrics. This information can be utilized for deeper analysis and strategic planning.
Expert Solution
This question has been solved!
Explore an expertly crafted, step-by-step solution for a thorough understanding of key concepts.
This is a popular solution
Trending nowThis is a popular solution!
Step by stepSolved in 3 steps with 2 images

Knowledge Booster
Learn more about
Need a deep-dive on the concept behind this application? Look no further. Learn more about this topic, accounting and related others by exploring similar questions and additional content below.Similar questions
- Stating an income statement in a common size format allows users to evaluate a firm’s performance in comparison to that of its competitors. True Falsearrow_forwardUsing the information provided below from Ben Company prepare two income statements: A normal GAAP Income Statement A CVP Income Statement These Income Statements should be done in good form and in Excel. Include formulas.arrow_forwardIdentify how each of the following transactions affects the company's financial statements. For the balance sheet, Identify how each transaction affects total assets, total llabilities, and equity. For the Income statement, Identify how each transaction affects profit. If there is an Increase, select a *+" In the column or columns. If there is a decrease, select a "-" In the column or columns. If there is both an Increase and a decrease, select a *+/-" In the column or columns. The Iline for the first transaction Is completed as an example. Income Statement Balance Sheet Total Total Transaction Equity Profit Assets Liabilities 1 Owner invests cash 2 Seli services for cash 3 Acquire services on credit 4 Pay wages with cash 5 Owner withdraws cash 6 Borrow cash with note payable 7 Sell services on credit 8 Buy office equipment for cash 9 Collect receivable from (7) 10 Buy asset with note payablearrow_forward
- The Income Statement (P&L) is a measure of an entity's economic performance (or “report card”) for a period of time. True Falsearrow_forwardcompany operating results include all of the following EXCEPT: a. Ratio Analysis b. Vertical Analysis c. Circular Analysis d. Horizontal Analysisarrow_forwardWhich of the following is the most useful in analyzing companies of different sizes? a.comparative statements b.common-sized financial statements c.price-level accounting d.audit reportarrow_forward
arrow_back_ios
arrow_forward_ios
Recommended textbooks for you

 AccountingAccountingISBN:9781337272094Author:WARREN, Carl S., Reeve, James M., Duchac, Jonathan E.Publisher:Cengage Learning,
 Accounting Information SystemsAccountingISBN:9781337619202Author:Hall, James A.Publisher:Cengage Learning,
 Horngren's Cost Accounting: A Managerial Emphasis...AccountingISBN:9780134475585Author:Srikant M. Datar, Madhav V. RajanPublisher:PEARSON
 Intermediate AccountingAccountingISBN:9781259722660Author:J. David Spiceland, Mark W. Nelson, Wayne M ThomasPublisher:McGraw-Hill Education
 Financial and Managerial AccountingAccountingISBN:9781259726705Author:John J Wild, Ken W. Shaw, Barbara Chiappetta Fundamental Accounting PrinciplesPublisher:McGraw-Hill Education


Accounting
Accounting
ISBN:9781337272094
Author:WARREN, Carl S., Reeve, James M., Duchac, Jonathan E.
Publisher:Cengage Learning,

Accounting Information Systems
Accounting
ISBN:9781337619202
Author:Hall, James A.
Publisher:Cengage Learning,

Horngren's Cost Accounting: A Managerial Emphasis...
Accounting
ISBN:9780134475585
Author:Srikant M. Datar, Madhav V. Rajan
Publisher:PEARSON

Intermediate Accounting
Accounting
ISBN:9781259722660
Author:J. David Spiceland, Mark W. Nelson, Wayne M Thomas
Publisher:McGraw-Hill Education

Financial and Managerial Accounting
Accounting
ISBN:9781259726705
Author:John J Wild, Ken W. Shaw, Barbara Chiappetta Fundamental Accounting Principles
Publisher:McGraw-Hill Education