Practical Management Science
6th Edition
ISBN: 9781337406659
Author: WINSTON, Wayne L.
Publisher: Cengage,
expand_more
expand_more
format_list_bulleted
Question
Help on Problem 8

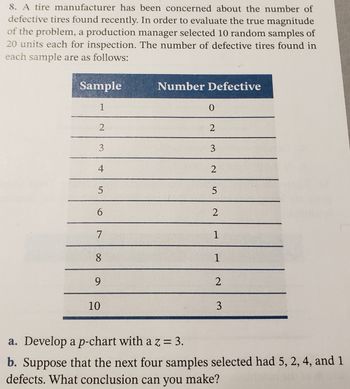
Transcribed Image Text:## Tire Manufacturer Quality Control
A tire manufacturer has been concerned about the number of defective tires found recently. To evaluate the true magnitude of the problem, a production manager selected 10 random samples of 20 units each for inspection. The number of defective tires found in each sample are as follows:
### Data Table
| Sample | Number Defective |
|--------|------------------|
| 1 | 0 |
| 2 | 2 |
| 3 | 3 |
| 4 | 2 |
| 5 | 5 |
| 6 | 2 |
| 7 | 1 |
| 8 | 1 |
| 9 | 2 |
| 10 | 3 |
### Exercises
**a.** Develop a p-chart with a z = 3.
**b.** Suppose that the next four samples selected had 5, 2, 4, and 1 defects. What conclusion can you make?
### Explanation
**a. p-chart Development**: A p-chart (proportion chart) is a type of control chart used to monitor the proportion of defective items in a process. To construct the p-chart, calculate the center line (average proportion defective), and the upper and lower control limits using the given z-value.
**b. Conclusion Analysis**: Analyze whether the new sample values fall within the control limits of the p-chart to determine if the process is still in control or if there are indications of a change in the process quality.
Expert Solution
This question has been solved!
Explore an expertly crafted, step-by-step solution for a thorough understanding of key concepts.
This is a popular solution
Trending nowThis is a popular solution!
Step by stepSolved in 2 steps with 6 images

Knowledge Booster
Similar questions
- Question 5 You are receiving an shipment and come across a box of shaving cream. What should you do? Please choose all that apply. Receive the shaving cream Raise an Andon CSecure it well with bubble wrap after scanning it in O Note is as Flammable on your workstation Submitarrow_forwardData of activities and weekly delivery costs Date Miles Driven Packages Delivered Delivery Stops Delivery Cost 1/1 2,656 15,700 12,175 $ 5,479 1/8 2,085 12,756 9,019 4,608 1/15 2,719 17,555 12,358 5,428 1/22 2,998 18,547 12,507 5,826 1/29 3,655 13,030 12,476 4,846 2/5 2,650 18,355 9,910 4,250 2/12 2,829 16,719 11,906 5,073 2/19 2,056 17,751 10,833 4,668 2/26 2,890 19,379 9,883 4,841 3/5 2,341 15,542 10,184…arrow_forwardAt Jill's Custom Cakes, Jill realized after the shop opened that there are enough ovens to bake 12 cakes at a time but only enough space to decorate 4 at a time. This demonstrates the importance of ______. Question 13 options: A) quality planning B) layout planning C) location planning D) capacity planning E) methods planningarrow_forward
- Question 38 of 50 Which statement best expresses empathy to a customer who got stuck in traffic and arrived late for an appointment? О "Traffic has been terrible lately with all the construction. It must have been so frustrating." "I'm sorry you got stuck in traffic. We should have warned you about the construction." "There's a lot of construction, so you might want to leave early next time to avoid the traffic." "Don't worry about it! We held your appointment and you won't be charged a late fee." Previous Nearrow_forwardTV and Media Questions In television programming, ____ is how channels and networks try to hold their audience from program to program, or from one segment of a program to another. Question 1 options: flow charting streaming rhythm Netflix CEO in 2017: "We're competing with ____." Question 2 options: eating sleeping reading showering Netflix embraces its role as a ____ , meaning that after the new season of a series is released, everyone around the world can watch and discuss it together. Question 3 options: transnational amplifier international regulator transnational broadcaster international conduitarrow_forward
arrow_back_ios
arrow_forward_ios
Recommended textbooks for you
 Practical Management ScienceOperations ManagementISBN:9781337406659Author:WINSTON, Wayne L.Publisher:Cengage,
 Operations ManagementOperations ManagementISBN:9781259667473Author:William J StevensonPublisher:McGraw-Hill Education
 Operations and Supply Chain Management (Mcgraw-hi...Operations ManagementISBN:9781259666100Author:F. Robert Jacobs, Richard B ChasePublisher:McGraw-Hill Education
 Purchasing and Supply Chain ManagementOperations ManagementISBN:9781285869681Author:Robert M. Monczka, Robert B. Handfield, Larry C. Giunipero, James L. PattersonPublisher:Cengage Learning
 Production and Operations Analysis, Seventh Editi...Operations ManagementISBN:9781478623069Author:Steven Nahmias, Tava Lennon OlsenPublisher:Waveland Press, Inc.

Practical Management Science
Operations Management
ISBN:9781337406659
Author:WINSTON, Wayne L.
Publisher:Cengage,

Operations Management
Operations Management
ISBN:9781259667473
Author:William J Stevenson
Publisher:McGraw-Hill Education

Operations and Supply Chain Management (Mcgraw-hi...
Operations Management
ISBN:9781259666100
Author:F. Robert Jacobs, Richard B Chase
Publisher:McGraw-Hill Education


Purchasing and Supply Chain Management
Operations Management
ISBN:9781285869681
Author:Robert M. Monczka, Robert B. Handfield, Larry C. Giunipero, James L. Patterson
Publisher:Cengage Learning

Production and Operations Analysis, Seventh Editi...
Operations Management
ISBN:9781478623069
Author:Steven Nahmias, Tava Lennon Olsen
Publisher:Waveland Press, Inc.