Concept explainers
Can you solve this one for me, and add all the calculation steps and interpretation. I also attached the related picture to this question. Thanks
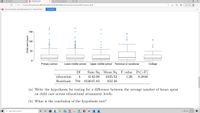
5. Child care hours. The China Health and Nutrition Survey aims to examine the effects of the
health, nutrition, and family planning policies and programs implemented by national and local
governments. It, for example, collects information on number of hours Chinese parents spend taking
care of their children under age 6. The side-by-side box plots below show the distribution of this
variable by educational attainment of the parent. Also provided below is the ANOVA output for
comparing average hours across educational attainment categories.
(a) Write the hypotheses for testing for a difference between the average number of hours spent
on child care across educational attainment levels.
(b) What is the conclusion of the hypothesis test?

Trending nowThis is a popular solution!
Step by stepSolved in 2 steps

- A recent report stated that in 1990, there were approximately 9.7 million employment opportunities in a Science, Technology, Engineering or Mathematics (STEM) related field. There is a reported 17.3 million positions available in a STEM related field in 2019. What is the relative change in the number of STEM positions available from 1990 to 2019? A. 7.6% B. 56.1% C. 43.9% D. 78.4%arrow_forwardFor the following line graph, State at least one type of conclusion that could be made from the data provided for the KPI. Suggest one other data source that would provide more information to make data-driven decisions. Explain what information that source would supply. (I used the clustered bar chart) Examples: 1) The completion KPI measures the percentage of South Texas College students who finished their degree or certificate program within six years. From the line graph, it can be seen that the completion rates have remained nearly constant through the years. Data from the THECB was used in this case. 2) Information about the percentage of students who receive credit for attempted courses is available on the South Texas College KPI webpage. According to the data, over the past five years, an increasing number of students have been receiving credit for courses they have attempted. Data on the percentage of students who complete courses, the percentage of students who withdraw…arrow_forward9) see picturesarrow_forward
- Hi please answer this practice problem, so I can review my work !arrow_forwardUsing the same data and information. Please answer this: Should you be encouraging or discouraging credit card sales? In answering this question, consider the following: Is the proportion of credit and non-credit sales significantly different? (a=.05) Is the average sale amount for credit sales different than the average sales amount for non-credit sales? (a=.05)arrow_forwardDefine "statistics." A. Statistics is how to best use numbers to persuade others B. Statistics is the study of how to best read tables and graphs C. Statistics is the study of how to best collect, analyze, and draw conclusions from data. D. Statistics is the study of how to best understand numbers.arrow_forward
- a. Make the case with graphs and numbers that women are a growing presence in the U.S. military. b. Make the case with graphs and numbers that women are a declining presence in the U.S. military. c. Write a paragraph that gives a balanced picture of the changing presence of women in the military using appropriate statistics to make your points. What additional data would be helpful?arrow_forwardB - Does there appear to be a relationship between income and sadness, hopelessness, and worthlessness? justify your answer in your own word. points Figure 2. Feelings of Worthlessness. Hopelessness, and Sadness All or Most of the Time, by Income. 2011 Percentage of adults 4.6% 3.8% Less than $35.000 3.2% Sadness 2,3% 1.9% $35.000-49.999 Hopelessness 2.3% 1.5% 1.1% $50,000-74,999 Annual family income Worthlessness 1.3% 0.6% 0.6% $75,000-99,999 1.2% 0.5% 0.6% $100,000 or morearrow_forwardExplain in detail "Variable Skewed in the Population"?arrow_forward
- Net Worth. The Board of Governors of the Federal Reserve System publishes information on family net worth in the Survey of Consumer Finances. In 2010, the mean net worth of families in the United States was $498.8 thousand and the median net worth was $77.3 thousand. Which measure of center do you think is more appropriate? Explain your answer.arrow_forwardyour car is more crowded than you think. table 5.8 reports results from a 1969 personal transportation survey on "home-to-work" trips in metropolitan areas. The survey stated that the average car occupancy was 1.4 people. check that calculation.arrow_forward• Accountant• Executive Secretary• Data Entry• Engineer• Human Resources Specialist• Sales Representative• Director of Administrative and Financial Affairs How can I rank and value these jobs using simple ranking method?arrow_forward
 MATLAB: An Introduction with ApplicationsStatisticsISBN:9781119256830Author:Amos GilatPublisher:John Wiley & Sons Inc
 Probability and Statistics for Engineering and th...StatisticsISBN:9781305251809Author:Jay L. DevorePublisher:Cengage Learning
 Statistics for The Behavioral Sciences (MindTap C...StatisticsISBN:9781305504912Author:Frederick J Gravetter, Larry B. WallnauPublisher:Cengage Learning
 Elementary Statistics: Picturing the World (7th E...StatisticsISBN:9780134683416Author:Ron Larson, Betsy FarberPublisher:PEARSON
 The Basic Practice of StatisticsStatisticsISBN:9781319042578Author:David S. Moore, William I. Notz, Michael A. FlignerPublisher:W. H. Freeman
 Introduction to the Practice of StatisticsStatisticsISBN:9781319013387Author:David S. Moore, George P. McCabe, Bruce A. CraigPublisher:W. H. Freeman


