
MATLAB: An Introduction with Applications
6th Edition
ISBN: 9781119256830
Author: Amos Gilat
Publisher: John Wiley & Sons Inc
expand_more
expand_more
format_list_bulleted
Related questions
Question
thumb_up100%
STATISTICS (THUMBS UP WILL BE GIVEN. PLEASE WRITE THE COMPLETE SOLUTION. DO NOT USE EXCEL OR SOFTWARE. DO NOT SHORTCUT. MANUAL COMPUTATIONS NEEDED. SEE THE ATTACHED IMAGE FOR THE AREAS UNDER NORMAL CURVE IF NECESSARY)
A university had an entrance policy that an applicant who placed at least 2 z- scores above the
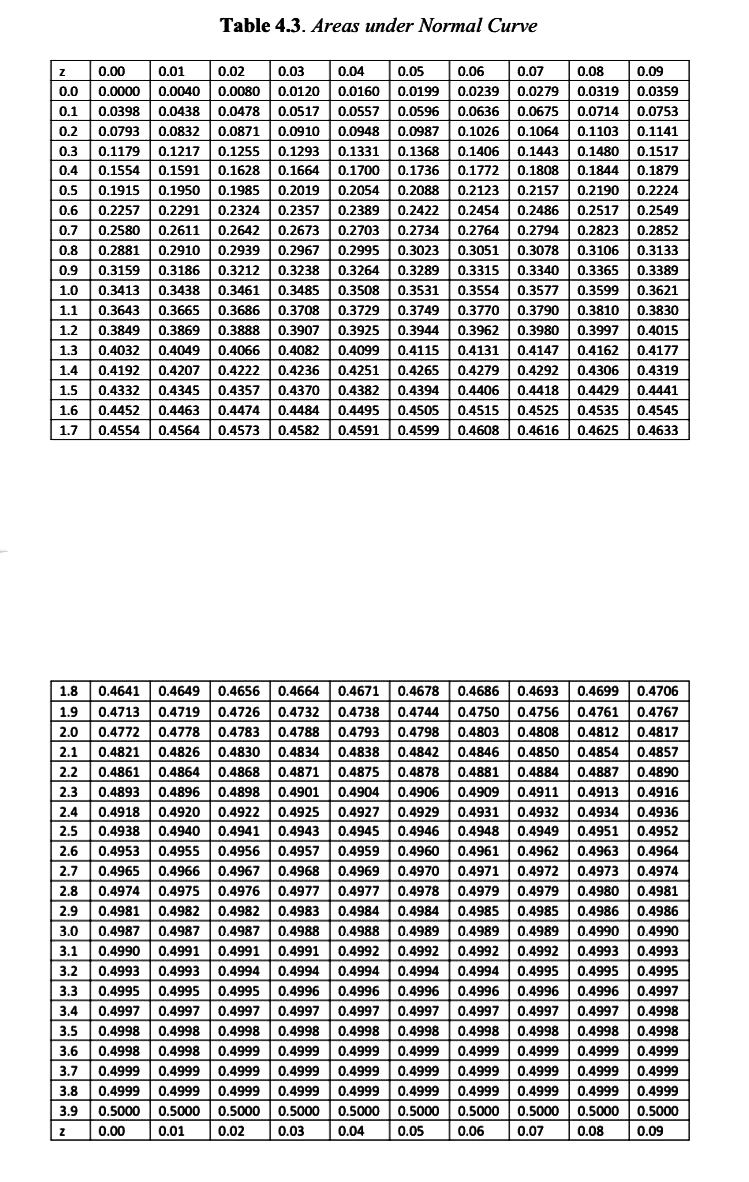

Transcribed Image Text:Table 4.3. Areas under Normal Curve
Z
0.01
0.04
0.1141
0.1517
0.1879
0.2224
0.00
0.02 0.03
0.05 0.06 0.07 0.08 0.09
0.0 0.0000 0.0040 0.0080 0.0120 0.0160 0.0199 0.0239 0.0279 0.0319 0.0359
0.1 0.0398 0.0438 0.0478 0.0517 0.0557 0.0596 0.0636 0.0675 0.0714 0.0753
0.2 0.0793 0.0832 0.0871 0.0910 0.0948 0.0987 0.1026 0.1064 0.1103
0.3 0.1179 0.1217 0.1255 0.1293 0.1331 0.1368 0.1406 0.1443 0.1480
0.4 0.1554 0.1591 0.1628 0.1664 0.1700 0.1736 0.1772 0.1808 0.1844
0.5 0.1915 0.1950 0.1985 0.2019
0.2054 0.2088 0.2123 0.2157 0.2190
0.6 0.2257 0.2291 0.2324 0.2357
0.2389
0.2422 0.2454
0.7 0.2580 0.2611 0.2642 0.2673 0.2703 0.2734 0.2764 0.2794 0.2823 0.2852
0.8 0.2881 0.2910 0.2939 0.2967 0.2995 0.3023 0.3051 0.3078 0.3106 0.3133
0.9 0.3159 0.3186 0.3212 0.3238 0.3264 0.3289 0.3315 0.3340 0.3365 0.3389
1.0 0.3413 0.3438 0.3461 0.3485 0.3508 0.3531 0.3554 0.3577 0.3599 0.3621
1.1 0.3643 0.3665 0.3686 0.3708
0.3749 0.3770 0.3790 0.3810
0.3944 0.3962 0.3980 0.3997
0.2486 0.2517 0.2549
0.3729
0.3830
1.2
0.3849
0.3869
0.3888
0.3907
0.4015
0.4049
0.4066
0.4082
0.4131 0.4147 0.4162
0.4177
0.3925
0.4099 0.4115
0.4222 0.4236 0.4251 0.4265
0.4357 0.4370 0.4382 0.4394
0.4279 0.4292 0.4306
1.3 0.4032
1.4 0.4192 0.4207
1.5 0.4332 0.4345
0.4406 0.4418 0.4429
1.6 0.4452 0.4463 0.4474 0.4484 0.4495 0.4505 0.4515 0.4525 0.4535 0.4545
1.7 0.4554 0.4564 0.4573 0.4582 0.4591 0.4599 0.4608 0.4616 0.4625 0.4633
0.4319
0.4441
0.4890
1.8 0.4641 0.4649 0.4656 0.4664 0.4671 0.4678 0.4686 0.4693 0.4699 0.4706
1.9 0.4713 0.4719 0.4726 0.4732 0.4738 0.4744 0.4750 0.4756 0.4761 0.4767
2.0 0.4772 0.4778 0.4783 0.4788 0.4793 0.4798 0.4803 0.4808 0.4812 0.4817
2.1 0.4821 0.4826 0.4830 0.4834 0.4838
0.4838 0.4842 0.4846 0.4850 0.4854 0.4857
2.2 0.4861 0.4864 0.4868 0.4871 0.4875 0.4878 0.4881 0.4884 0.4887
2.3 0.4893 0.4896 0.4898 0.4901 0.4904 0.4906 0.4909 0.4911 0.4913 0.4916
2.4 0.4918 0.4920 0.4922 0.4925 0.4927 0.4929 0.4931 0.4932 0.4934 0.4936
2.5 0.4938 0.4940 0.4941 0.4943 0.4945 0.4946 0.4948 0.4949 0.4951 0.4952
2.6 0.4953 0.4955 0.4956 0.4957 0.4959 0.4960 0.4961 0.4962 0.4963 0.4964
2.7 0.4965 0.4966
0.4967 0.4968 0.4969 0.4970 0.4971 0.4972 0.4973 0.4974
2.8 0.4974 0.4975 0.4976 0.4977 0.4977 0.4978 0.4979 0.4979 0.4980 0.4981
2.9 0.4981 0.4982 0.4982 0.4983 0.4984 0.4984 0.4985 0.4985 0.4986
0.4986
3.0 0.4987 0.4987 0.4987 0.4988 0.4988 0.4989 0.4989 0.4989 0.4990
3.1 0.4990 0.4991 0.4991 0.4991 0.4992 0.4992 0.4992 0.4992 0.4993
3.2 0.4993 0.4993 0.4994 0.4994 0.4994 0.4994 0.4994 0.4995 0.4995
3.3 0.4995 0.4995 0.4995 0.4996 0.4996 0.4996 0.4996 0.4996 0.4996
0.4997
3.4 0.4997 0.4997 0.4997 0.4997 0.4997 0.4997 0.4997 0.4997 0.4997 0.4998
0.4998 0.4998 0.4998
0.4998 0.4998 0.4998 0.4998 0.4998 0.4998 0.4998
3.6 0.4998 0.4998 0.4999 0.4999 0.4999 0.4999 0.4999 0.4999 0.4999 0.4999
3.7 0.4999 0.4999 0.4999 0.4999 0.4999 0.4999 0.4999 0.4999 0.4999 0.4999
3.8 0.4999 0.4999 0.4999 0.4999 0.4999 0.4999 0.4999 0.4999 0.4999 0.4999
3.9 0.5000 0.5000 0.5000 0.5000 0.5000 0.5000 0.5000 0.5000 0.5000 0.5000
Z
0.00 0.01 0.02 0.03 0.04 0.05
0.4990
0.4993
0.4995
3.5
0.06
0.07
0.08
0.09
Expert Solution
This question has been solved!
Explore an expertly crafted, step-by-step solution for a thorough understanding of key concepts.

Step by stepSolved in 2 steps

Knowledge Booster

Similar questions
- please answer in text form and in proper format answer with must explanation , calculation for each part and steps clearlyarrow_forwardhelp pleasearrow_forwardDetermine the range, mean, and standard deviation of the data set. {9,5,9,17,17,16,3,8} Please note that I did submit this question earlier but was unable to recognize the answers so I would appreciate it if it the answers are written clearly. Thank youarrow_forward
- please give some detailed solution and please do not copy other's work,thanks!! According to a union agreement, the mean income for all senior-level assembly-line workers in a large company is $500 per week. A representative of a women's group decides to analyse whether the mean income for female employees matches this norm. For a random sample of 50 female employees, the mean is $410 and the SD is $90. Test with a-0.05, whether the mean income of female employees differs from $500 per week. What is the probability of the Type II error in this case?arrow_forwardPlease provide a correct answer with a full method explanation and do not copy and paste from other similar questions. This question is multiple choice so please give me a correct answer from the given five options.arrow_forwardPlease discuss the concepts of Mean, Median, Mode, and Standard Deviation, including when each should be used, and evaluate the differences of each. How can knowing this information about data help us?arrow_forward
arrow_back_ios
SEE MORE QUESTIONS
arrow_forward_ios
Recommended textbooks for you
- MATLAB: An Introduction with ApplicationsStatisticsISBN:9781119256830Author:Amos GilatPublisher:John Wiley & Sons Inc
 Probability and Statistics for Engineering and th...StatisticsISBN:9781305251809Author:Jay L. DevorePublisher:Cengage Learning
 Statistics for The Behavioral Sciences (MindTap C...StatisticsISBN:9781305504912Author:Frederick J Gravetter, Larry B. WallnauPublisher:Cengage Learning
  Elementary Statistics: Picturing the World (7th E...StatisticsISBN:9780134683416Author:Ron Larson, Betsy FarberPublisher:PEARSON
 The Basic Practice of StatisticsStatisticsISBN:9781319042578Author:David S. Moore, William I. Notz, Michael A. FlignerPublisher:W. H. Freeman
 Introduction to the Practice of StatisticsStatisticsISBN:9781319013387Author:David S. Moore, George P. McCabe, Bruce A. CraigPublisher:W. H. Freeman
MATLAB: An Introduction with Applications
Statistics
ISBN:9781119256830
Author:Amos Gilat
Publisher:John Wiley & Sons Inc
Probability and Statistics for Engineering and th...
Statistics
ISBN:9781305251809
Author:Jay L. Devore
Publisher:Cengage Learning
Statistics for The Behavioral Sciences (MindTap C...
Statistics
ISBN:9781305504912
Author:Frederick J Gravetter, Larry B. Wallnau
Publisher:Cengage Learning
Elementary Statistics: Picturing the World (7th E...
Statistics
ISBN:9780134683416
Author:Ron Larson, Betsy Farber
Publisher:PEARSON
The Basic Practice of Statistics
Statistics
ISBN:9781319042578
Author:David S. Moore, William I. Notz, Michael A. Fligner
Publisher:W. H. Freeman
Introduction to the Practice of Statistics
Statistics
ISBN:9781319013387
Author:David S. Moore, George P. McCabe, Bruce A. Craig
Publisher:W. H. Freeman