MATLAB: An Introduction with Applications
6th Edition
ISBN: 9781119256830
Author: Amos Gilat
Publisher: John Wiley & Sons Inc
expand_more
expand_more
format_list_bulleted
Question
Need help with this question please

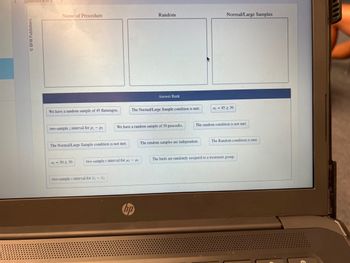
Transcribed Image Text:Question 4 of 5
ⒸBFW Publishers
Name of Procedure
We have a random sample of 45 flamingos.
two-sample z interval for p₁ - P2
The Normal/Large Sample condition is not met.
n₂ = 30 ≥ 30
two-sample r interval for x₁ - x₂
Random
two-sample interval for ₁-2
Answer Bank
The Normal/Large Sample condition is met.
We have a random sample of 30 peacocks.
Normal/Large Samples
The random samples are independent.
m₁ = 45230
The random condition is not met.
The Random condition is met.
The birds are randomly assigned to a treatment group.
c

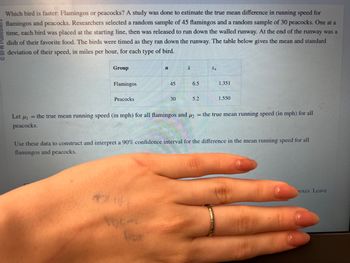
Transcribed Image Text:Which bird is faster: Flamingos or peacocks? A study was done to estimate the true mean difference in running speed for
flamingos and peacocks. Researchers selected a random sample of 45 flamingos and a random sample of 30 peacocks. One at a
time, each bird was placed at the starting line, then was released to run down the walled runway. At the end of the runway was a
dish of their favorite food. The birds were timed as they ran down the runway. The table below gives the mean and standard
deviation of their speed, in miles per hour, for each type of bird.
Group
Flamingos
Peacocks
n
45
30
X
6.5
5.2
Sx
1.351
1.550
Let u₁ = the true mean running speed (in mph) for all flamingos and ₂ = the true mean running speed (in mph) for all
peacocks.
Use these data to construct and interpret a 90% confidence interval for the difference in the mean running speed for all
flamingos and peacocks.
oxes. Leave
Expert Solution
This question has been solved!
Explore an expertly crafted, step-by-step solution for a thorough understanding of key concepts.
This is a popular solution
Trending nowThis is a popular solution!
Step by stepSolved in 4 steps with 3 images

Knowledge Booster
Similar questions
Recommended textbooks for you
 MATLAB: An Introduction with ApplicationsStatisticsISBN:9781119256830Author:Amos GilatPublisher:John Wiley & Sons Inc
 Probability and Statistics for Engineering and th...StatisticsISBN:9781305251809Author:Jay L. DevorePublisher:Cengage Learning
 Statistics for The Behavioral Sciences (MindTap C...StatisticsISBN:9781305504912Author:Frederick J Gravetter, Larry B. WallnauPublisher:Cengage Learning
 Elementary Statistics: Picturing the World (7th E...StatisticsISBN:9780134683416Author:Ron Larson, Betsy FarberPublisher:PEARSON
 The Basic Practice of StatisticsStatisticsISBN:9781319042578Author:David S. Moore, William I. Notz, Michael A. FlignerPublisher:W. H. Freeman
 Introduction to the Practice of StatisticsStatisticsISBN:9781319013387Author:David S. Moore, George P. McCabe, Bruce A. CraigPublisher:W. H. Freeman

MATLAB: An Introduction with Applications
Statistics
ISBN:9781119256830
Author:Amos Gilat
Publisher:John Wiley & Sons Inc

Probability and Statistics for Engineering and th...
Statistics
ISBN:9781305251809
Author:Jay L. Devore
Publisher:Cengage Learning

Statistics for The Behavioral Sciences (MindTap C...
Statistics
ISBN:9781305504912
Author:Frederick J Gravetter, Larry B. Wallnau
Publisher:Cengage Learning

Elementary Statistics: Picturing the World (7th E...
Statistics
ISBN:9780134683416
Author:Ron Larson, Betsy Farber
Publisher:PEARSON

The Basic Practice of Statistics
Statistics
ISBN:9781319042578
Author:David S. Moore, William I. Notz, Michael A. Fligner
Publisher:W. H. Freeman

Introduction to the Practice of Statistics
Statistics
ISBN:9781319013387
Author:David S. Moore, George P. McCabe, Bruce A. Craig
Publisher:W. H. Freeman