
MATLAB: An Introduction with Applications
6th Edition
ISBN: 9781119256830
Author: Amos Gilat
Publisher: John Wiley & Sons Inc
expand_more
expand_more
format_list_bulleted
Related questions
Question
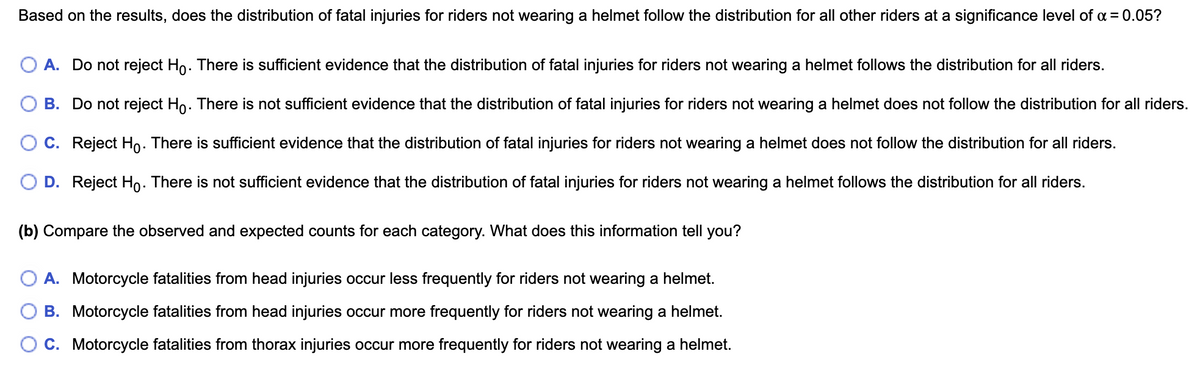

Transcribed Image Text:Based on the results, does the distribution of fatal injuries for riders not wearing a helmet follow the distribution for all other riders at a significance level of α = 0.05?
A. Do not reject Ho. There is sufficient evidence that the distribution of fatal injuries for riders not wearing a helmet follows the distribution for all riders.
B. Do not reject Ho. There is not sufficient evidence that the distribution of fatal injuries for riders not wearing a helmet does not follow the distribution for all riders.
C. Reject Ho. There is sufficient evidence that the distribution of fatal injuries for riders not wearing a helmet does not follow the distribution for all riders.
D. Reject Ho. There is not sufficient evidence that the distribution of fatal injuries for riders not wearing a helmet follows the distribution for all riders.
(b) Compare the observed and expected counts for each category. What does this information tell you?
O A. Motorcycle fatalities from head injuries occur less frequently for riders not wearing a helmet.
B. Motorcycle fatalities from head injuries occur more frequently for riders not wearing a helmet.
C. Motorcycle fatalities from thorax injuries occur more frequently for riders not wearing a helmet.

Transcribed Image Text:A traffic safety company publishes reports about motorcycle fatalities and helmet use. In the first accompanying data table, the distribution shows the proportion of fatalities by location of injury for
motorcycle accidents. The second data table shows the location of injury and fatalities for 2061 riders not wearing a helmet. Complete parts (a) and (b) below.
Click the icon to view the tables.
(a) Does the distribution of fatal injuries for riders not wearing a helmet follow the distribution for all riders? Use α = 0.05 level of significance. What are the null and alternative hypotheses?
O A. Ho: The distribution of fatal injuries for riders not wearing a helmet follows the same distribution for all other riders.
H₁: The distribution of fatal injuries for riders not wearing a helmet does not follow the same distribution for all other riders.
B. Ho: The distribution of fatal injuries for riders not wearing a helmet does not follow the same distribution for all other riders.
H₁: The distribution of fatal injuries for riders not wearing a helmet does follow the same distribution for all other riders.
C. None of these.
Compute the expected counts for each fatal injury.
Location of injury
Multiple Locations
Observed Count
1030
868
37
81
45
Head
Neck
Thorax
Abdomen/Lumbar/Spine
(Round to two decimal places as needed.)
What is the P-value of the test?
Expected Count
P-value= (Round to three decimal places as needed.)
Screen Shot 2023-... Ⓡ
Distribution of fatalities by location of injury
Location of
injury
Proportion
Proportion of fatalities by location of injury for motorcycle accidents
Abdomen/
Multiple
Lumbar/
locations
0.570
Spine
0.030
Head
Location of
injury
Number
0.310
Head
Neck
868
0.030
M
Location of injury and fatalities for 2061 riders not wearing a helmet
Multiple
locations
1030
Thorax
0.060
Neck
37
Thorax
81
I
Full data set
Abdomen/
Lumbar/
Spine
45
Expert Solution
This question has been solved!
Explore an expertly crafted, step-by-step solution for a thorough understanding of key concepts.

This is a popular solution

Trending nowThis is a popular solution!

Step by stepSolved in 6 steps with 11 images

Knowledge Booster

Similar questions
- A survey taken in a hotel shows the number of cups of coffee consumed with each meal.Find the relative frequency corresponding to the meal number 5. Frequency 5 Meal Number 3 3 2 а. 50% b. 20% 30% d. 40%arrow_forwardIf a researcher wants to find out the average monthly expenses of all university students in Edmonton, this average would be an example of ________ . a. samplecross out b. statisticcross out c. populationcross out d. parameterarrow_forwardProblem #3: Given the following five pairs of (x, y) values, 13 0 3 11 7 10 8 6 3 1 Problem #3(a): Problem #3(b): X (a) Determine the least squares regression line. (b) Calculate the residual sum of squares SSE. enter the values of bo and b₁ (in that order), separated by a comma (numbers correct to 4 decimals) SSE (correct to 4 decimals)arrow_forward
- d. Estimate the blood pressure of the student if his stress test score is 80, 60, and 85.arrow_forwarddear sir mam how do u create a steam and leaf data plotarrow_forwardThe boxplot shown below results from the heights (cm) of males listed in a data set. What do the numbers in that boxplot tell us? 151 172.5 192 168.5 182.6 A boxplot consists of a box that extends from 168.5 to 182.6, a vertical line segment drawn through the box at 172.5, and a horizontal line segment extending from a vertical line segment at 151 to a vertical line segment at 192 that bisects the box. Question content area bottom Part 1 The minimum height is enter your response here cm, the first quartile Q1 is enter your response here cm, the second quartile Q2 (or the median) is enter your response here cm, the third quartile Q3 is enter your response here cm, and the maximum height is enter your response here cm. (Type integers or decimals. Do not round.)arrow_forward
- Profits per shop Number of shop 0–100- 12 100–200 18 200-300 27 300–400 20 400–500 17 500-600 06arrow_forwardA property analyst is examining the relationship between the City Council's valuation on residential property and the market value (selling price) of the properties. A random sample of 8 recent property transactions were examined. The data is recorded in the tables below. Find the intercept (rounded off to four decimals). 1 2 3 4 5 6 7 8 A. 0.0892 B. -4.0293 OC. 6.7128 D. 1.285 City Council valuation (R1000) 12 45 32 50 28 56 18 40 Market value (R1000) 65 220 142 310 196 364 116 260 SSxy=10319.875 SSY = 70990.875 Exy=69084 b = 6.1912 SSX 1666.875 x = 34.4286 y=209.125arrow_forwardSolve. 4) Construct a box plot from the data below. 20 25 26 26 26 272933 41 43 45 46 47 4850 50 50 51 53 55 57 60 61 62 63arrow_forward
- Use this data which give the dosage levels for a particular drug and the heart rate measured 30 minutes after taking the drug. Dose (mg) Heart rate 0.125 95 0.20 90 0.25 93 0.30 92 0.35 88 0.40 80 0.50 82 Create a scatter plot. Use your Ti-84arrow_forwardWhich country of origin appears to have the highest “typical” miles per gallon? [ Select ] ["USA", "Sweden", "France", "Japan", "Italy", "Germany"] Which country of origin has the most variation in miles per gallon? [ Select ] ["Sweden", "USA", "France", "Italy", "Japan", "Germany"]arrow_forwardIs the variable(foot print) below normally distributed or skewed? If skewed, indicate the direction. male shoe print #1 32.2 #2 30.1 #3 29.0 #4 31.8 #5 29.4arrow_forward
arrow_back_ios
SEE MORE QUESTIONS
arrow_forward_ios
Recommended textbooks for you
- MATLAB: An Introduction with ApplicationsStatisticsISBN:9781119256830Author:Amos GilatPublisher:John Wiley & Sons Inc
 Probability and Statistics for Engineering and th...StatisticsISBN:9781305251809Author:Jay L. DevorePublisher:Cengage Learning
 Statistics for The Behavioral Sciences (MindTap C...StatisticsISBN:9781305504912Author:Frederick J Gravetter, Larry B. WallnauPublisher:Cengage Learning
  Elementary Statistics: Picturing the World (7th E...StatisticsISBN:9780134683416Author:Ron Larson, Betsy FarberPublisher:PEARSON
 The Basic Practice of StatisticsStatisticsISBN:9781319042578Author:David S. Moore, William I. Notz, Michael A. FlignerPublisher:W. H. Freeman
 Introduction to the Practice of StatisticsStatisticsISBN:9781319013387Author:David S. Moore, George P. McCabe, Bruce A. CraigPublisher:W. H. Freeman
MATLAB: An Introduction with Applications
Statistics
ISBN:9781119256830
Author:Amos Gilat
Publisher:John Wiley & Sons Inc
Probability and Statistics for Engineering and th...
Statistics
ISBN:9781305251809
Author:Jay L. Devore
Publisher:Cengage Learning
Statistics for The Behavioral Sciences (MindTap C...
Statistics
ISBN:9781305504912
Author:Frederick J Gravetter, Larry B. Wallnau
Publisher:Cengage Learning
Elementary Statistics: Picturing the World (7th E...
Statistics
ISBN:9780134683416
Author:Ron Larson, Betsy Farber
Publisher:PEARSON
The Basic Practice of Statistics
Statistics
ISBN:9781319042578
Author:David S. Moore, William I. Notz, Michael A. Fligner
Publisher:W. H. Freeman
Introduction to the Practice of Statistics
Statistics
ISBN:9781319013387
Author:David S. Moore, George P. McCabe, Bruce A. Craig
Publisher:W. H. Freeman