
MATLAB: An Introduction with Applications
6th Edition
ISBN: 9781119256830
Author: Amos Gilat
Publisher: John Wiley & Sons Inc
expand_more
expand_more
format_list_bulleted
Related questions
Question
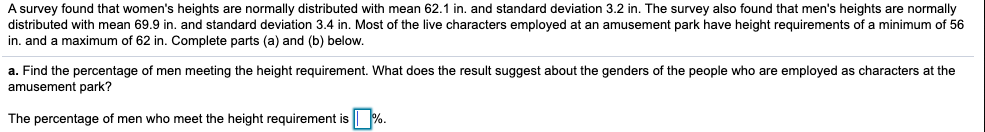

Transcribed Image Text:A survey found that women's heights are normally distributed with mean 62.1 in. and standard deviation 3.2 in. The survey also found that men's heights are normally
distributed with mean 69.9 in. and standard deviation 3.4 in. Most of the live characters employed at an amusement park have height requirements of a minimum of 56
in. and a maximum of 62 in. Complete parts (a) and (b) below.
a. Find the percentage of men meeting the height requirement. What does the result suggest about the genders of the people who are employed as characters at the
amusement park?
The percentage of men who meet the height requirement is %.
Expert Solution
This question has been solved!
Explore an expertly crafted, step-by-step solution for a thorough understanding of key concepts.

This is a popular solution

Trending nowThis is a popular solution!

Step by stepSolved in 2 steps with 5 images

Knowledge Booster

Similar questions
- A survey found that women's heights are normally distributed with mean 62.1 in. and standard deviation 3.3 in. The survey also found that men's heights are normally distributed with mean 67.9 in. and standard deviation 3.4 in. Most of the live characters employed at an amusement park have height requirements of a minimum of 55 in. and a maximum of 62in. Complete parts (a) and (b) below. a. Find the percentage of men meeting the height requirement. What does the result suggest about the genders of the people who are employed as characters at the amusement park? The percentage of men who meet the height requirement is nothing %.arrow_forwardCalculate the standard deviation from the following data: Heights in cm 150 155 160 165 170 175 180 No. of students 15 24 32 33 24 16 6 [Ans.: 8.038 cm]arrow_forwardIn this problem, assume that the distribution of differences is approximately normal. Note: For degrees of freedom d.f. not in the Student's t table, use the closest d.f. that is smaller. In some situations, this choice of d.f. may increase the P-value by a small amount and therefore produce a slightly more "conservative" answer. Suppose that at five weather stations on Trail Ridge Road in Rocky Mountain National Park, the peak wind gusts (in miles per hour) for January and April are recorded below. Wilderness District 1 2 3 4 5 January 122 122 130 64 78 April 114 115 114 88 61 Does this information indicate that the peak wind gusts are higher in January than in April? Use ? = 0.01. Solve the problem using the critical region method of testing. (Let d = January − April. Round your answers to three decimal places.) test statistic = critical value =arrow_forward
- In this problem, assume that the distribution of differences is approximately normal. Note: For degrees of freedom d.f. not in the Student's t table, use the closest d.f. that is smaller. In some situations, this choice of d.f. may increase the P-value by a small amount and therefore produce a slightly more "conservative" answer. At five weather stations on Trail Ridge Road in Rocky Mountain National Park, the peak wind gusts (in miles per hour) for January and April are recorded below. Weather Station January April USE SALT Does this information indicate that the peak wind gusts are higher in January than in April? Use α = 0.01. (Let d = January - April.) (a) What is the level of significance? 1 2 3 4 5 137 120 126 64 78 104 115 102 88 61 State the null and alternate hypotheses. Will you use a left-tailed, right-tailed, or two-tailed test? Ho: My = 0₁ H₁: 0; two-tailed O Hoi Hd O1 H₁: M O Hot Hd = 0; H₁: O Hot Hd = 0; H₁² = 0; right-tailed 0; right-tailed (b) What sampling…arrow_forwardStudents at TAMUCT pay on average $5,200 per semester for tuition with a standar deviation of $120. In a group of 1,000 students, how many would we expect to pay more than $5,500 per semester?arrow_forwardThe data set of size 40 has mean 15 and standard deviation 2. Approximately how many observations lie between 13 and 17?arrow_forward
- A survey found that women's heights are normally distributed with mean 63.4 in. and standard deviation 2.5 in. The survey also found that men's heights are hormally distributed with mean 68.3 in. and standard deviation 3.7 in. Most of the live characters employed at an amusement park have height requirements of a minimum of 57 in. and a maximum of 62 in. Complete parts (a) and (b) below. a. Find the percentage of men meeting the height requirement. What does the result suggest about the genders of the people who are employed as characters at he amusement park? The percentage of men who meet the height requirement is %. Round to two decimal places as needed.)arrow_forwardConsider the data from the Anthropology 105 class. The mean for women is 64.33 in and the standard deviation is 2.64 in. The average height of men in the US is approximately 5ft 10in. What proportion of women represented here are shorter than the average man?arrow_forwardIn this problem, assume that the distribution of differences is approximately normal. Note: For degrees of freedom d.f. not in the Student's t table, use the closest d.f. that is smaller. In some situations, this choice of d.f. may increase the P-value by a small amount and therefore produce a slightly more "conservative" answer.Suppose that at five weather stations on Trail Ridge Road in Rocky Mountain National Park, the peak wind gusts (in miles per hour) for January and April are recorded below. Wilderness District 1 2 3 4 5 January 128 139 129 64 78 April 115 104 115 88 61 Does this information indicate that the peak wind gusts are higher in January than in April? Use α = 0.01. Solve the problem using the critical region method of testing. (Let d = January − April. Round your answers to three decimal places.) test statistic = critical value =arrow_forward
- In this problem, assume that the distribution of differences is approximately normal. Note: For degrees of freedom d.f. not in the Student's t table, use the closest d.f. that is smaller. In some situations, this choice of d.f. may increase the P-value by a small amount and therefore produce a slightly more "conservative" answer.The artifact frequency for an excavation of a kiva in Bandelier National Monument gave the following information. Stratum Flaked Stone Tools Nonflaked Stone Tools 1 10 2 2 10 3 3 9 2 4 1 3 5 4 7 6 38 32 7 51 30 8 25 12 What is the value of the sample test statistic? (Round your answer to three decimal places.)arrow_forwardplease show work.arrow_forward
arrow_back_ios
arrow_forward_ios
Recommended textbooks for you
- MATLAB: An Introduction with ApplicationsStatisticsISBN:9781119256830Author:Amos GilatPublisher:John Wiley & Sons Inc
 Probability and Statistics for Engineering and th...StatisticsISBN:9781305251809Author:Jay L. DevorePublisher:Cengage Learning
 Statistics for The Behavioral Sciences (MindTap C...StatisticsISBN:9781305504912Author:Frederick J Gravetter, Larry B. WallnauPublisher:Cengage Learning
  Elementary Statistics: Picturing the World (7th E...StatisticsISBN:9780134683416Author:Ron Larson, Betsy FarberPublisher:PEARSON
 The Basic Practice of StatisticsStatisticsISBN:9781319042578Author:David S. Moore, William I. Notz, Michael A. FlignerPublisher:W. H. Freeman
 Introduction to the Practice of StatisticsStatisticsISBN:9781319013387Author:David S. Moore, George P. McCabe, Bruce A. CraigPublisher:W. H. Freeman
MATLAB: An Introduction with Applications
Statistics
ISBN:9781119256830
Author:Amos Gilat
Publisher:John Wiley & Sons Inc
Probability and Statistics for Engineering and th...
Statistics
ISBN:9781305251809
Author:Jay L. Devore
Publisher:Cengage Learning
Statistics for The Behavioral Sciences (MindTap C...
Statistics
ISBN:9781305504912
Author:Frederick J Gravetter, Larry B. Wallnau
Publisher:Cengage Learning
Elementary Statistics: Picturing the World (7th E...
Statistics
ISBN:9780134683416
Author:Ron Larson, Betsy Farber
Publisher:PEARSON
The Basic Practice of Statistics
Statistics
ISBN:9781319042578
Author:David S. Moore, William I. Notz, Michael A. Fligner
Publisher:W. H. Freeman
Introduction to the Practice of Statistics
Statistics
ISBN:9781319013387
Author:David S. Moore, George P. McCabe, Bruce A. Craig
Publisher:W. H. Freeman