MATLAB: An Introduction with Applications
6th Edition
ISBN: 9781119256830
Author: Amos Gilat
Publisher: John Wiley & Sons Inc
expand_more
expand_more
format_list_bulleted
Question
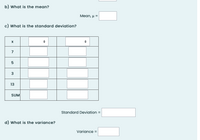
Assume that the values x below, represent data collected for a population. Calculate the summary statistics indicated below. You will fill in the blanks to SHOW YOUR WORK. State your answers with four decimal places where appropriate.
| x |
|---|
| 7 |
| 5 |
| 3 |
| 13 |
a) What is the
Mean, μ = ?
b) What is the standard deviation?
Standard Deviation =?
d) What is the variance?
Variance =?

Transcribed Image Text:b) What is the mean?
Mean, µ =
c) What is the standard deviation?
7
13
SUM
Standard Deviation
%3D
d) What is the variance?
Variance =
Expert Solution
This question has been solved!
Explore an expertly crafted, step-by-step solution for a thorough understanding of key concepts.
Step by stepSolved in 2 steps with 3 images

Knowledge Booster
Similar questions
- Show your work answer questions belowarrow_forwardThe advertising expenditure per month, in dollars, at a tourism company are given below. 1600 1800 2500 1500 3200 4500 6000 3200 1200 5000 1..Calculate the variance and standard deviation, interquartile range and coefficient of variation. 2..What conclusion can you reach about advertising expenditure at this store.arrow_forward24arrow_forward
- (2) Look at the dotplot of the data below: 200 400 600 800 1000 1200 CHOL a. Estimate (don't calculate) the mean. 1 MATH16 - ELEMENTARY STATISTICS WRITTEN HW #3 - SECTIONS 3.1 - 3.3 b. Would you expect the median to be less than / more than / or approximately equal to the mean? Explain your reasoning.arrow_forwardTest 1, #2. Given the small data sample below, complete the following tasks by hand: 37 42 31 38 43 35 33 40 32 a. Find the standard deviation of the data sample. CE COLLEGE COLLEGEarrow_forward#8. Using Minitab to illustrate the Central Limit Theorem (CLT), the CLT tells us about the sampling distribution of the sample mean. With Minitab we can easily "sample" from a population with known properties (4,0 , shape). a. Our population consists of integer values X from 1 through 8, all equally likely Р(x) 3D 1/8; х %3D 1, 2, 3, 4, 5, 6, 7, 8 Using methods from the beginning of Chapter 4 in the textbook, find u. Use your calculator to find u. What is the shape of this probability distribution? Does it o =2.29 "look" Normal? b. Take a sample of size 3 from this population and compute the sample mean. Repeat this process 1000 times. Click on Calc > Random Data Rows 1000 Store in columns C1-C3 Distribution Integer Minimum 1 Maximum 8 Compute the mean of each sample (row) and store the sample means in C4. Note: C4 has 1000 sample means each a sample of size n=3. Click on Calc → Row Statistics O Mean Input Variables C1-C3 Store C4arrow_forward
- Please show workarrow_forwardA sample of blood pressure measurements is taken from a data set and those values (mm Hg) are listed below. The values are matched so that subjects each have systolic and diastolic measurements. Find the mean and median for each of the two samples and then compare the two sets of results. Are the measures of center the best statistics to use with these data? What else might be better? Systolic: 122 137 158 114 156 143 99 112 115 152 Diastolic: 61 51 76 73 55 58 74 60 87 59 Find the means. The mean for systolic is mm Hg and the mean for diastolic is mm Hg. (Type integers or decimals rounded to one decimal place as needed.) ***arrow_forwardPage 2 of 5 B. Organizing and Working with Data. 1. Find the z-score for the weight of a 155-pound woman. The mean weight of woman age 20 or older is 170.6 pounds with a standard deviation of 5.4 pounds. Round your answer to two decimal places.arrow_forward
arrow_back_ios
SEE MORE QUESTIONS
arrow_forward_ios
Recommended textbooks for you
 MATLAB: An Introduction with ApplicationsStatisticsISBN:9781119256830Author:Amos GilatPublisher:John Wiley & Sons Inc
 Probability and Statistics for Engineering and th...StatisticsISBN:9781305251809Author:Jay L. DevorePublisher:Cengage Learning
 Statistics for The Behavioral Sciences (MindTap C...StatisticsISBN:9781305504912Author:Frederick J Gravetter, Larry B. WallnauPublisher:Cengage Learning
 Elementary Statistics: Picturing the World (7th E...StatisticsISBN:9780134683416Author:Ron Larson, Betsy FarberPublisher:PEARSON
 The Basic Practice of StatisticsStatisticsISBN:9781319042578Author:David S. Moore, William I. Notz, Michael A. FlignerPublisher:W. H. Freeman
 Introduction to the Practice of StatisticsStatisticsISBN:9781319013387Author:David S. Moore, George P. McCabe, Bruce A. CraigPublisher:W. H. Freeman

MATLAB: An Introduction with Applications
Statistics
ISBN:9781119256830
Author:Amos Gilat
Publisher:John Wiley & Sons Inc

Probability and Statistics for Engineering and th...
Statistics
ISBN:9781305251809
Author:Jay L. Devore
Publisher:Cengage Learning

Statistics for The Behavioral Sciences (MindTap C...
Statistics
ISBN:9781305504912
Author:Frederick J Gravetter, Larry B. Wallnau
Publisher:Cengage Learning

Elementary Statistics: Picturing the World (7th E...
Statistics
ISBN:9780134683416
Author:Ron Larson, Betsy Farber
Publisher:PEARSON

The Basic Practice of Statistics
Statistics
ISBN:9781319042578
Author:David S. Moore, William I. Notz, Michael A. Fligner
Publisher:W. H. Freeman

Introduction to the Practice of Statistics
Statistics
ISBN:9781319013387
Author:David S. Moore, George P. McCabe, Bruce A. Craig
Publisher:W. H. Freeman