MATLAB: An Introduction with Applications
6th Edition
ISBN: 9781119256830
Author: Amos Gilat
Publisher: John Wiley & Sons Inc
expand_more
expand_more
format_list_bulleted
Question

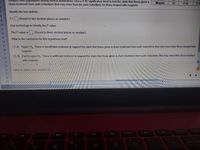
Transcribed Image Text:samples from populations having normal distributions. Use a 0.05 significance level to test the claim that those given a
sham treatment have pain reductions that vary more than the pain reductions for those treated with magnets.
Magnet
20
045
09
7.
Identify the test statistic.
F =
(Round to two decimal places as needed.)
10
Use technology to identify the P value.
11
The P-value isIN Round to three decimal places as needed.)
12
13
What is the conclusion for this hypothesis test?
14
15
O A. Reject HW There is insufficient evidence to support the claim that those given a sham treatment have pain reductions that vary more than those treated with
16
magnets
17
O B. Fail 10 veject Ho. There is sufficient evidence to support the claim that those given a sham treatment have pain reductions that vary more than those treated
with magnets.
18
19
20
21
Click to selecy your answer(s).
22
23
24
25
8.

Transcribed Image Text:EQuestion Help
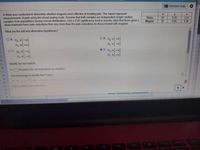
A study was conducted to determine whether magnets were effective in treating pain. The values represent
measurements of pain using the visual analog scale. Assume that both samples are independent simple random
samples from populations having normal distributions. Use a 0.05 significance level to test the claim that those given a
sham treatment have pain reductions that vary more than the pain reductions for those treated with magnets.
Sham
20
20
0.43
1.21
0.96
Magnet
0 45
What are the null and altemative hypotheses?
OA Ho o-0
H, oo
OC. Ho -
OB. H o10
H, o -o
D. Hy o
H, of ca
2.
13
14
15
Identify the test statistic
16
Fx
(Round to two decimal places as needed)
17
18
Use technology to identily the Pavalue
19
20
21
Click to select your answers)
22
23
home
delete
Expert Solution
This question has been solved!
Explore an expertly crafted, step-by-step solution for a thorough understanding of key concepts.
This is a popular solution
Trending nowThis is a popular solution!
Step by stepSolved in 2 steps

Knowledge Booster
Learn more about
Need a deep-dive on the concept behind this application? Look no further. Learn more about this topic, statistics and related others by exploring similar questions and additional content below.Similar questions
- The droning sound ofarrow_forward7. Consider the following ANOVA table for a multiple regression model: Source df SS MS F Regression 118.8475 59.42375 40.92168993 Residual 13.0692 1.452133333 Total 11 131.9167 a) Complete the remaining entries in the table. e) Test the significance of the overall regression model using a=0.05.arrow_forwardA test of sobriety involves measuring the subject's motor skills. Twenty randomly-selected sober subjects take the test and produce a mean score of 41.0 with a standard deviation of 3.7. At the 0.01 level of significance, test the claim that the true mean score for all sober subjects is equal to 35.0. Use the traditional method of testing hypotheses. The results for the test turn out to be: Ho: H = 35.0. H1:µ/35.0. Test statistic: t 7.252. Critical values: t = -2.861, 2.861. Reject Ho. There is sufficient evidence to warrant rejection of the claim that the mean is equal to 35.0. If a defense attorney argues the results are not valid because the sample size was too small, is his argument valid here? Yes, because the t-test is not as powerful as the z-test. No, because we rejected the null hypothesis. Yes, because we rejected the null hypothesis. O No, the sample size is never an issuc. O We need more information to answer.arrow_forward
- Listed below are systolic blood pressure measurements (mm Hg) taken from the right and left arms of the same woman. Assume that the paired sample data is a simple random sample and that the differences have a distribution that is approximately normal. Use a 0.10 significance level to test for a difference between the measurements from the two arms. Identify the test statistic and p-value. Right arm Left arm 144 167 OA.T-3.07, p-value = 0.037 OB. T = -2.32, p-value = 0.081 OC. T = -1.93, p-value = 0.127 OD. T = -4.01, p-value = 0.016 133 161 132 179 138 145 136 144arrow_forwardwhat do part b and part f say? I'm unsure what all the words say.arrow_forwardA study was conducted to investigate drinking problems among college students. In 1983, a group of students were asked whether they had ever driven an automobile while drinking. In 1987, after the legal drinking age was raised, a different group of college students was asked the same question. The results are as shown in the table below. Test to compare the proportions of students with a drinking problem at 0.05 level of significance, 1987 versus 1983; and provide the chi-squared statistic value below (in 2 decimal places). Year Drove while drinking Yes No 1983 1,258 1,355 1987 994 1,643arrow_forward
- Which is not one of the major assumptions typically associated with parametric tests of significance? A. Random Selection B. Homogeneity of Variance C. Absence of restricted rangesarrow_forwardYou wish to determine the average VO2max (maximum rate of oxygen consumption, often associated with athletic performance) of a sample of 100 Olympic athletes, and to use a quantitative metric to assess your confidence in the average (mean) value. You calculate a mean of 71 ml/kg/min and a variance of 26.06 from your sample. Question: What are the standard error of the mean (SEM) and the approximate 95% CI of the mean?arrow_forwardManagers of an outdoor coffee stand in Coast City are examing the relationship between (hot) coffee sales and daily temperature, hoping to be able to predict a day's total coffee sales from the maximum temperature that day. The bivariate data values for the coffee sales (denoted by y, in dollars) and the maximum temperature (denoted by x, in degrees Fahrenheit) for each of fifteen randomly selected days during the past year are given below. These data are plotted in the scatter plot in Figure 1. Also given are the products of the temperature values and coffee sales values for each of the fifteen days. (These products, written in the column labelled "xy," may aid in calculations.)arrow_forward
- Does the average Presbyterian donate less than the average Catholic in church on Sundays? The 58 randomly observed members of the Presbyterian church donated an average of $24 with a standard deviation of $15. The 42 randomly observed members of the Catholic church donated an average of $31 with a standard deviation of $7. What can be concluded at the αα = 0.10 level of significance? For this study, we should use Select an answer t-test for the difference between two dependent population means z-test for a population proportion t-test for a population mean t-test for the difference between two independent population means z-test for the difference between two population proportions The null and alternative hypotheses would be: H0:H0: Select an answer p1 μ1 Select an answer ≠ > = < Select an answer p2 μ2 (please enter a decimal) H1:H1: Select an answer p1 μ1 Select an answer < = ≠ > Select an answer p2 μ2 (Please enter a decimal) The test statistic ?…arrow_forwardA study was conducted to examine how fear of public speaking varies across year of tertiary education (1st, 2nd or 3rd). Subjects were interviewed at the end of each of year of their tertiary education for fear of public speaking (measured on a 10 point metric scale). Which of the following would be an appropriate statistical test to conduct, which addresses these hypotheses? Group of answer choices: Factorial ANOVA Mixed ANOVA Multiple Regression Within Subjects ANOVA Single Factor ANOVAarrow_forwardAn experiment was carried out to compare the sound distortion produced by 4 different types of coating on magnetic tape. The ANOVA table for this data is given below, where X indicates a missing value. Source Degrees of Freedom Sum of Squares Mean Squares IF Treatment X 14.49 X Error X X X Total 49 165.69 Compute the F statistic. Give your answer to 2 decimal places.arrow_forward
arrow_back_ios
SEE MORE QUESTIONS
arrow_forward_ios
Recommended textbooks for you
 MATLAB: An Introduction with ApplicationsStatisticsISBN:9781119256830Author:Amos GilatPublisher:John Wiley & Sons Inc
 Probability and Statistics for Engineering and th...StatisticsISBN:9781305251809Author:Jay L. DevorePublisher:Cengage Learning
 Statistics for The Behavioral Sciences (MindTap C...StatisticsISBN:9781305504912Author:Frederick J Gravetter, Larry B. WallnauPublisher:Cengage Learning
 Elementary Statistics: Picturing the World (7th E...StatisticsISBN:9780134683416Author:Ron Larson, Betsy FarberPublisher:PEARSON
 The Basic Practice of StatisticsStatisticsISBN:9781319042578Author:David S. Moore, William I. Notz, Michael A. FlignerPublisher:W. H. Freeman
 Introduction to the Practice of StatisticsStatisticsISBN:9781319013387Author:David S. Moore, George P. McCabe, Bruce A. CraigPublisher:W. H. Freeman

MATLAB: An Introduction with Applications
Statistics
ISBN:9781119256830
Author:Amos Gilat
Publisher:John Wiley & Sons Inc

Probability and Statistics for Engineering and th...
Statistics
ISBN:9781305251809
Author:Jay L. Devore
Publisher:Cengage Learning

Statistics for The Behavioral Sciences (MindTap C...
Statistics
ISBN:9781305504912
Author:Frederick J Gravetter, Larry B. Wallnau
Publisher:Cengage Learning

Elementary Statistics: Picturing the World (7th E...
Statistics
ISBN:9780134683416
Author:Ron Larson, Betsy Farber
Publisher:PEARSON

The Basic Practice of Statistics
Statistics
ISBN:9781319042578
Author:David S. Moore, William I. Notz, Michael A. Fligner
Publisher:W. H. Freeman

Introduction to the Practice of Statistics
Statistics
ISBN:9781319013387
Author:David S. Moore, George P. McCabe, Bruce A. Craig
Publisher:W. H. Freeman