
A First Course in Probability (10th Edition)
10th Edition
ISBN: 9780134753119
Author: Sheldon Ross
Publisher: PEARSON
expand_more
expand_more
format_list_bulleted
Related questions
Concept explainers
Topic Video
Question

Transcribed Image Text:### One-Generation Transition Probabilities Study
#### Overview
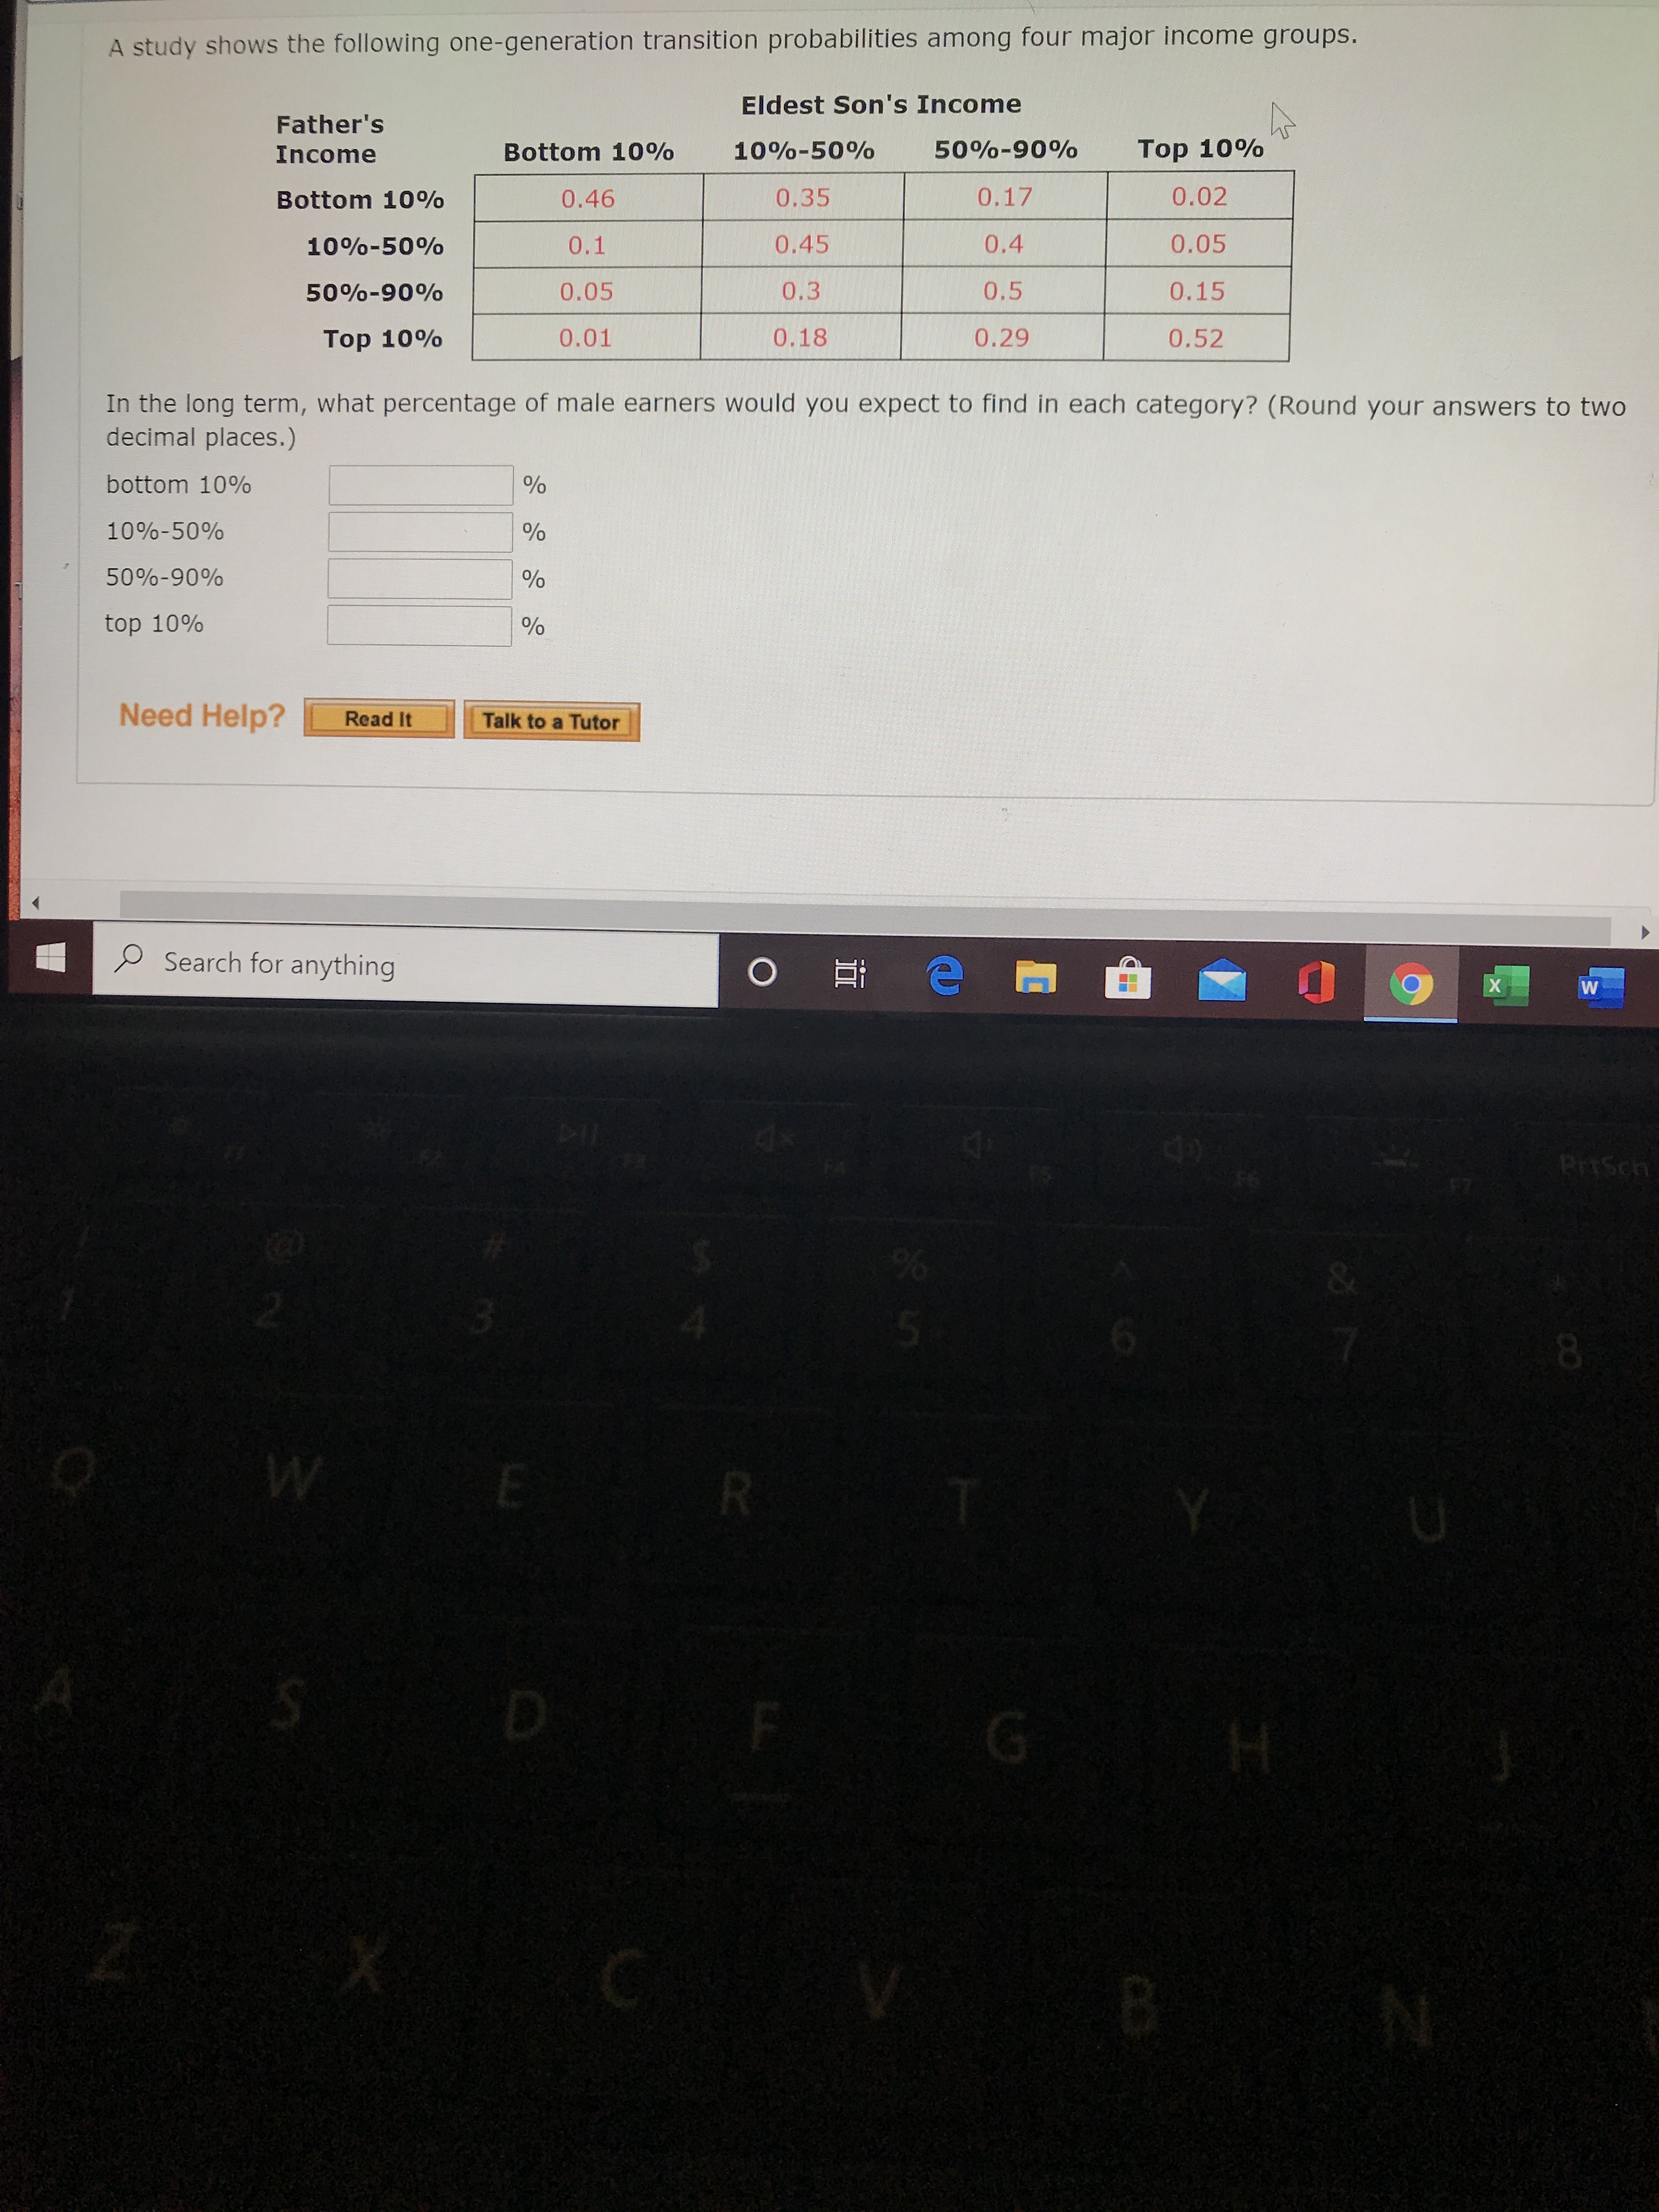
A study displays the one-generation transition probabilities among four major income groups. This data compares the income group of fathers and their eldest sons.
#### Transition Probabilities Table
The table below illustrates the probabilities of an eldest son transitioning between different income groups relative to their father's income group.
| Father's Income | Bottom 10% | 10%-50% | 50%-90% | Top 10% |
| --------------- | ----------- | ------------ | ---------- | --------- |
| **Bottom 10%** | 0.46 | 0.35 | 0.17 | 0.02 |
| **10%-50%** | 0.1 | 0.45 | 0.4 | 0.05 |
| **50%-90%** | 0.05 | 0.3 | 0.5 | 0.15 |
| **Top 10%** | 0.01 | 0.18 | 0.29 | 0.52 |
#### Analysis
The table above outlines the following key points:
- Eldest sons of fathers in the bottom 10% income group have a 46% chance to remain in the same income group.
- Sons of fathers in the top 10% income group have a 52% chance to remain in the top 10%.
- Mobility is especially noted within the 10%-50% and 50%-90% income groups, where sons have higher probabilities to stay within or move between these middle-income ranges compared to the extremes (bottom and top 10%).
#### Discussion Question
Given the transition probabilities outlined in the table, calculate the expected percentage of male earners in each category in the long term. (Round your answers to two decimal places.)
- **Bottom 10%**: ___________ %
- **10%-50%**: ___________ %
- **50%-90%**: ___________ %
- **Top 10%**: ___________ %
Need Help?
- Read more about economic mobility theory.
- Discuss your answers with a tutor.
*Note: Understanding these probabilities is essential for grasping the concept of economic mobility and how income groups can influence one's economic status over generations.*
Expert Solution
This question has been solved!
Explore an expertly crafted, step-by-step solution for a thorough understanding of key concepts.

This is a popular solution

Trending nowThis is a popular solution!

Step by stepSolved in 2 steps with 5 images

Knowledge Booster


Learn more about
Need a deep-dive on the concept behind this application? Look no further. Learn more about this topic, probability and related others by exploring similar questions and additional content below.Similar questions
- Management of the New-Fangled Soft drink Company believes that the probability of a customer purchasing Red Pop or the company’s major competition, Super Cola, is based on the customer’s most recent purchase. Suppose that the following transition probabilities are appropriate: To From Red Pop Super Cola Red Pop 0.9 0.1 Super Cola 0.1 0.9 1. Show the two-period tree diagram for a customer who last purchased Red Pop. What is the probability that this customer purchases Red Pop on the second purchase? 2. What is the long-run market share for each of these two products? 3. A Red Pop advertising campaign is being planned to increase the probability of attracting Super Cola customers. Management believes that the new campaign will increase to 0.15…arrow_forwardIllustrate Volatility Clustering and Autoregressive Conditional Heteroskedasticity?arrow_forwardnvesting: Inverse ETFs (Exchange Traded Funds) Inverse ETFs, sometimes referred to as "bear market" or "short" funds, are designed to deliver the opposite of the performance of the index or category they track, and so can be used by traders to bet against the stock market. The following table shows the performance of three such funds as of August 5, 2015.† Year-to-DateLoss (%) MYY (ProShares Short Midcap 400) 6 SH (ProShares Short S&P 500) 5 REW (ProShares UltraShort Technology) 7 You invested a total of $8,000 in the three funds at the beginning of 2011, including an equal amount in SH and REW. Your year-to-date loss from the first two funds amounted to $340. How much did you invest in each of the three funds? MYY$ SH$ REW$arrow_forward
- 2. A decision tree is provided. Develop Product Sell Idea Lease for Royalty Show Transcribed Text Produce & Market Sell Idea Company A Company B A. Calculate Expected value (EV) at every node. Show work. B. What is the optimum decision and EV? C. If your risk tolerance is $0, what is the best decision and EV? (.5) Large Market (.5) Low Mkt. (.5) Large Market (.5) Low Mkt. (.5) Large Market (.5) Low Mkt. (.5) Large Market (.5) Low Mkt. Payoff (S millions) 5.0 -3.0 3.0 0 1.8 1.0 6.0 -1.0 1.0arrow_forwardAn airline offers "advance-purchase" fares to customers who buy their tickets at least four weeks before the flight. The airline has noticed that 80% of its customers who buy tickets don't take advantage of advance-purchase fares and the remaining 20% do. The no-show rate for those who don't have advance-purchase fares is 25%, while for those who do have them, it is only 15%. (a) Calculate the probabilities labeled on the tree diagram below. (Give answers correct to three decimal places.) A tree diagram with 6 branches is shown. The tree diagram begins at a point and an upper and lower branch extend from this point to the right. From each of these two branches two more upper and lower branches extend to the right. The branches extending from the first point from top to bottom are labeled a and b and end at points labeled "no advance purchase" and "advance purchase" respectively. The branches extending from "no advance purchase" and "advance purchase" from top to bottom are labeled…arrow_forwardA. 8.51%B. 55%C. 84.08%D. 91.59%arrow_forward
- Consider the case of two financial assets and three market conditions (states). The tablebelow gives the respective probability for each market condition and the return of each assetin each one of them. Market Conditions State Recession Normal Expansion Probability of state 30% 40% 30% Return of asset A -30% 20% 55% Return of asset B -10% 70% 0% a. Derive the expected returns and the standard deviation of returns for the two assetsabove.arrow_forwardb) Blue Star United, a major electronics distributor, has hired Southwest Forecasters, a market research firm, to predict the level of demand for its new product that combines cell phone and complete Internet capabilities at a price substantially below its major competitors. As part of its deliverables, Southwest provides a rating of Poor, Fair, or Good, on the basis of its research. Prior to engaging Southwest Blue Star, management concluded the following probabilities for the market-demand levels: P(Low)== P(s1) = 0.1 P(Moderate) = P(s2) = 0.5 P(High) = P(s3) = 0.4 Southwest completes its study and concludes that the market potential for this product is poor. What conclusion should Blue Star reach based on the market-study results? Proportion of Assessments Provided by a Market-Research Organization Prior to Various Levels of Market Demand (Conditional Probabilities) are given in, the following table: Market Demand That Actually Occurred After Assessment Was Provided Moderate Demand…arrow_forwardA new product has the following profit projections and associated probabilities: Profit Probability $150,000 .10 $100,000 .25 $50,000 .20 $0 .15 -$50,00 .20 -$100,000 .10 a) use the expected value approach to decide whether to market the new product b) because of the high dollar values involved, especially the possibility of a $100,000 loss, the marketing vice president has expressed some concern about the use of the expected value approach. As a consequence, if a utility analysis is performed, what is the appropriate lottery? c) assume that the following indifference probabilities are assigned. Profit indifference Probability (p) $100,000 .95 $50,000 .70 $0 .50…arrow_forward
arrow_back_ios
arrow_forward_ios
Recommended textbooks for you
- A First Course in Probability (10th Edition)ProbabilityISBN:9780134753119Author:Sheldon RossPublisher:PEARSON

A First Course in Probability (10th Edition)
Probability
ISBN:9780134753119
Author:Sheldon Ross
Publisher:PEARSON