
MATLAB: An Introduction with Applications
6th Edition
ISBN: 9781119256830
Author: Amos Gilat
Publisher: John Wiley & Sons Inc
expand_more
expand_more
format_list_bulleted
Related questions
Question
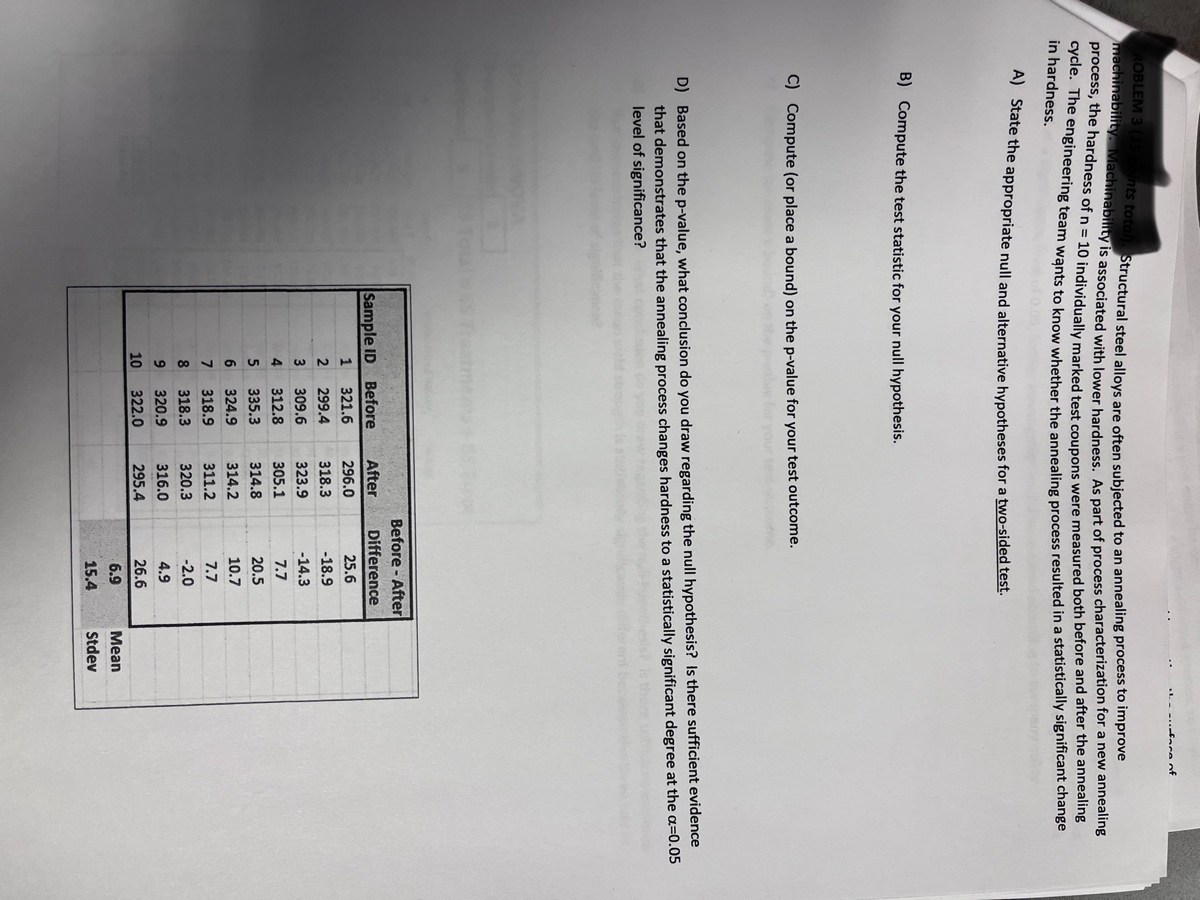

Transcribed Image Text:ROBLEM 3 (15 points total). Structural steel alloys are often subjected to an annealing process to improve
machinability. Machinability is associated with lower hardness. As part of process characterization for a new annealing
process, the hardness of n = 10 individually marked test coupons were measured both before and after the annealing
cycle. The engineering team wants to know whether the annealing process resulted in a statistically significant change
in
A) State the appropriate null and alternative hypotheses for a two-sided test.
B) Compute the test statistic for your null hypothesis.
C) Compute (or place a bound) on the p-value for your test outcome.
D) Based on the p-value, what conclusion do you draw regarding the null hypothesis? Is there sufficient evidence
that demonstrates that the annealing process changes hardness to a statistically significant degree at the a=0.05
level of significance? what
After
1 321.6 296.0
2 299.4
318.3
3 309.6
323.9
4 312.8
305.1
5 335.3
314.8
6 324.9
314.2
7
318.9
311.2
8 318.3
320.3
9 320.9
316.0
10
322.0
295.4
Sample ID Before
...face of
Before - After
Difference
25.6
-18.9
-14.3
7.7
20.5
10.7
7.7
-2.0
4.9
26.6
6.9
15.4
Mean
Stdev
Expert Solution
This question has been solved!
Explore an expertly crafted, step-by-step solution for a thorough understanding of key concepts.

Step by stepSolved in 2 steps with 1 images

Knowledge Booster

Similar questions
- (c) Calculate the test statistic. d) Decide whether to reject or fail to reject the null hypothesis. Then interpret the decision in the context of the original claim.arrow_forwardWhich of the following is the first step in hypothesis testing? (a) Developing a null and alternative hypothesis. (b) Drawing a sample from the population. (c) It does not matter where you begin when you test hypotheses. (d) Setting the cutoff value for rejecting the null hypothesis.arrow_forwardB. Identify the test statistic test C. Identify the P-value for this hypothesis test D. If P-value is reject H0 or fail to reject H0?arrow_forward
- Suppose you have a hypothesis test which never rejects the null hypothesis, no matter the value of the test statistic. Name a potential problem with such a test. Select one: a. There can be no problem with such a hypothesis test, this is the ideal scenario. b. Using this test would lead to making an excessive number of Type I errors. c. Using this test would lead to making an excessive number of Type II errors.arrow_forwardPassed Failed White Results from a civil servant exam are shown in the table to the right. Is there sufficient evidence to support the claim that the results from the test are discriminatory? Use a 0.05 significance level. 16 14 candidates Minority candidates 7 21 Determine the null and alternative hypotheses. O A. Ho: White and minority candidates do not have the same chance of passing the test. H4: White and minority candidates have the same chance of passing the test. B. Ho: A white candidate is more likely to pass the test than a minority candidate. H,:A white candidate is not more likely to pass the test than a minority candidate. Ho: A white candidate is not more likely to pass the test than a minority candidate. H,: A white candidate is more likely to pass the test than a minority candidate. D. Ho: White and minority candidates have the same chance of passing the test. H,: White and minority candidates do not have the same chance of passing the test. Determine the test…arrow_forwardH.P. statistician, please show work and neat handwritingarrow_forward
- A university has decided to introduce the use of plus and minus grading as long as there is evidence that 60% of the faculty is in support of this change. Write an appropriate null hypothesis and alternate hypothesis to test if the proportion is greater than 60%.arrow_forward1.) Identify the null and alternative hypotheses for this test. 2.) Identify the test statistic for this hypothesis test. (Round to two decimal places as needed.) 3.) Identify the P-value for this hypothesis test. (Round to three decimal places as needed.) 4.) Identify the conclusion for this hypothesis test.arrow_forward4. Explain the procedure for testing a hypothesis using the P-value approach? What is the criterion for judging whether to reject the null hypothesis?arrow_forward
arrow_back_ios
arrow_forward_ios
Recommended textbooks for you
- MATLAB: An Introduction with ApplicationsStatisticsISBN:9781119256830Author:Amos GilatPublisher:John Wiley & Sons Inc
 Probability and Statistics for Engineering and th...StatisticsISBN:9781305251809Author:Jay L. DevorePublisher:Cengage Learning
 Statistics for The Behavioral Sciences (MindTap C...StatisticsISBN:9781305504912Author:Frederick J Gravetter, Larry B. WallnauPublisher:Cengage Learning
  Elementary Statistics: Picturing the World (7th E...StatisticsISBN:9780134683416Author:Ron Larson, Betsy FarberPublisher:PEARSON
 The Basic Practice of StatisticsStatisticsISBN:9781319042578Author:David S. Moore, William I. Notz, Michael A. FlignerPublisher:W. H. Freeman
 Introduction to the Practice of StatisticsStatisticsISBN:9781319013387Author:David S. Moore, George P. McCabe, Bruce A. CraigPublisher:W. H. Freeman
MATLAB: An Introduction with Applications
Statistics
ISBN:9781119256830
Author:Amos Gilat
Publisher:John Wiley & Sons Inc
Probability and Statistics for Engineering and th...
Statistics
ISBN:9781305251809
Author:Jay L. Devore
Publisher:Cengage Learning
Statistics for The Behavioral Sciences (MindTap C...
Statistics
ISBN:9781305504912
Author:Frederick J Gravetter, Larry B. Wallnau
Publisher:Cengage Learning
Elementary Statistics: Picturing the World (7th E...
Statistics
ISBN:9780134683416
Author:Ron Larson, Betsy Farber
Publisher:PEARSON
The Basic Practice of Statistics
Statistics
ISBN:9781319042578
Author:David S. Moore, William I. Notz, Michael A. Fligner
Publisher:W. H. Freeman
Introduction to the Practice of Statistics
Statistics
ISBN:9781319013387
Author:David S. Moore, George P. McCabe, Bruce A. Craig
Publisher:W. H. Freeman