
MATLAB: An Introduction with Applications
6th Edition
ISBN: 9781119256830
Author: Amos Gilat
Publisher: John Wiley & Sons Inc
expand_more
expand_more
format_list_bulleted
Related questions
Concept explainers
Question
A researcher wants to determine if there is a relationship between the number of hours spent by students on social media sites and self-esteem levels. A random sample of 10 statistics students was part of the study. Use manual calculations at α = 0.05 to calculate whether there is a significant relationship between the two variables. Show all your calculations.
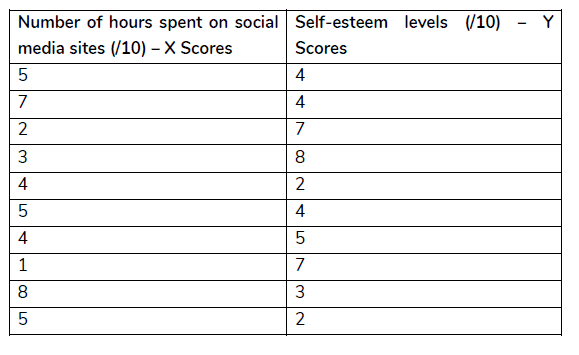

Transcribed Image Text:Number of hours spent on social Self-esteem levels (/10)
media sites (/10) – X Scores
Y
Scores
4
7
4
2
7
3
8
4
4
4
1
7
8
2
Expert Solution
This question has been solved!
Explore an expertly crafted, step-by-step solution for a thorough understanding of key concepts.

This is a popular solution

Trending nowThis is a popular solution!

Step by stepSolved in 2 steps with 2 images

Knowledge Booster


Learn more about
Need a deep-dive on the concept behind this application? Look no further. Learn more about this topic, statistics and related others by exploring similar questions and additional content below.Similar questions
- Click this Video for Finding Correlation Coefficient by Using Formula. Yessica thought that there was a correlation between the amount of time students slept the evening before their final exam and their final exam grade. She took an SRS of 5 students in her class and recorded the sleep time the evening before their final exam, and their final exam score. Let the sleep time the evening before the final exam represents the explanatory variable, and the final exam score be the response variable. Below is a sample data set. x (hour) 8 9 3 9 1 2 3 4 5 Calculate the sample correlation coefficient (r) to three decimal places. r= 9 Why would we expect the correlation coefficient to be positive? As the sleep time increases, exam score increases As the sleep time increases, exam score decreases As the sleep time decreases, exam score increases There is no change in exam score to sleep time C E y (score) 91 94 51 100 90 C Aarrow_forwardExplain what restriction of range is and what it tends to do to the magnitude of a correlation.arrow_forwardA researcher measures GPA and height for a group of high school students. What kind of correlation is likely to be obtained for these two variables?arrow_forward
- Summarize the definitions for linear correlation, quadratic correlations and exponential correlations. Provide an example graph of each of the types of correlation along with your summarized definitions.arrow_forwardA researcher investigates the relationship between study habits and college achievement. College seniors were administered the Inventory of Study Habits Survey (X) to measure study habits and the College BASE (Y) was used to measure overall college achievement. The correlation between the study habits and achievement was found to be 0.784. The researcher concluded that students with higher scores on the Study Habits Survey will always have higher college achievement scores on the College BASE. Is the researcher's conclusion correct? Why or why not?arrow_forwardA random sample of college students was surveyed about how they spend their time each week. The scatterplot below displays the relationship between the number of hours each student typically works per week at a part- or full-time job and the number of hours of television each student typically watches per week. The correlation between these variables is r = –0.63, and the equation we would use to predict hours spent watching TV based on hours spent working is as follows: Predicted hours spent watching TV = 17.21 – 0.23(hours spent working) Since we are using hours spent working to help us predict hours spent watching TV, we’d call hours spent working a(n) __________________ variable and hours spent watching TV a(n) __________________ variable. The correlation coefficient, along with what we see in the scatterplot, tells us that the relationship between the variables has a direction that is _________________ and a strength that is ______________________. According to the…arrow_forward
- The trend of thinner beauty pageant winners has generated charges that the contest encourages unhealthy diet habits among young women. Listed below are body mass indexes (BMI) for beauty pageant winners from two different time periods. Find the coefficient of variation for each of the two sets of data, then compare the variation. The coefficient of variation for the BMI's of beauty pageant winners from the 1920s and 1930s is %arrow_forwardFor a sample of eight bears, researchers measured the distances around the bears' chests and weighed the bears. Minitab was used to find that the value of the linear correlation coefficient is r = 0.862. Using a = 0.05, determine if there is a linear correlation between chest size and weight. What proportion of the variation in weight can be explained by the linear relationship between weight and chest size? Click here to view a table of critical values for the correlation coefficient. a. Is there a linear correlation between chest size and weight? O A. No, because the absolute value of r exceeds the critical value of 0.707. O B. Yes, because r falls between the critical values of -0.707 and 0.707. O C. Yes, because the absolute value of r exceeds the critical value of 0.707. O D. The answer cannot be determined from the given information. b. What proportion of the variation in weight can be explained by the linear relationship between weight and chest size? (Round to three decimal…arrow_forwardState the empirical rule for variables.arrow_forward
- Suppose the correlation between height and weight for adults is +0.40.What proportion (or percent) of the variability in weight can be explained by the relationship with height?arrow_forwardPlease anwser using SPSS!arrow_forwardIn a data set with 25 scores, if the value 16 occurs 12 times, what is its relative frequency?arrow_forward
arrow_back_ios
SEE MORE QUESTIONS
arrow_forward_ios
Recommended textbooks for you
- MATLAB: An Introduction with ApplicationsStatisticsISBN:9781119256830Author:Amos GilatPublisher:John Wiley & Sons Inc
 Probability and Statistics for Engineering and th...StatisticsISBN:9781305251809Author:Jay L. DevorePublisher:Cengage Learning
 Statistics for The Behavioral Sciences (MindTap C...StatisticsISBN:9781305504912Author:Frederick J Gravetter, Larry B. WallnauPublisher:Cengage Learning
  Elementary Statistics: Picturing the World (7th E...StatisticsISBN:9780134683416Author:Ron Larson, Betsy FarberPublisher:PEARSON
 The Basic Practice of StatisticsStatisticsISBN:9781319042578Author:David S. Moore, William I. Notz, Michael A. FlignerPublisher:W. H. Freeman
 Introduction to the Practice of StatisticsStatisticsISBN:9781319013387Author:David S. Moore, George P. McCabe, Bruce A. CraigPublisher:W. H. Freeman
MATLAB: An Introduction with Applications
Statistics
ISBN:9781119256830
Author:Amos Gilat
Publisher:John Wiley & Sons Inc
Probability and Statistics for Engineering and th...
Statistics
ISBN:9781305251809
Author:Jay L. Devore
Publisher:Cengage Learning
Statistics for The Behavioral Sciences (MindTap C...
Statistics
ISBN:9781305504912
Author:Frederick J Gravetter, Larry B. Wallnau
Publisher:Cengage Learning
Elementary Statistics: Picturing the World (7th E...
Statistics
ISBN:9780134683416
Author:Ron Larson, Betsy Farber
Publisher:PEARSON
The Basic Practice of Statistics
Statistics
ISBN:9781319042578
Author:David S. Moore, William I. Notz, Michael A. Fligner
Publisher:W. H. Freeman
Introduction to the Practice of Statistics
Statistics
ISBN:9781319013387
Author:David S. Moore, George P. McCabe, Bruce A. Craig
Publisher:W. H. Freeman