Glencoe Algebra 1, Student Edition, 9780079039897, 0079039898, 2018
18th Edition
ISBN: 9780079039897
Author: Carter
Publisher: McGraw Hill
expand_more
expand_more
format_list_bulleted
Question

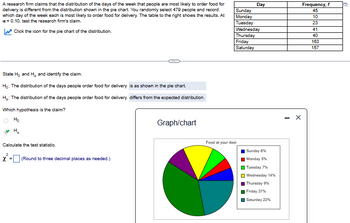
Transcribed Image Text:A research firm claims that the distribution of the days of the week that people are most likely to order food for
delivery is different from the distribution shown in the pie chart. You randomly select 479 people and record
which day of the week each is most likely to order food for delivery. The table to the right shows the results. At
a=0.10, test the research firm's claim.
Sunday
Monday
Tuesday
Click the icon for the pie chart of the distribution.
State H₁ and H., and identify the claim.
Ho: The distribution of the days people order food for delivery is as shown in the pie chart.
H.: The distribution of the days people order food for delivery differs from the expected distribution.
Which hypothesis is the claim?
Но
На
Calculate the test statistic.
X = (Round to three decimal places as needed.)
Graph/chart
Day
Frequency, f
45
10
23
Wednesday
41
Thursday
40
Friday
163
Saturday
157
Food at your door
Sunday 6%
Monday 5%
Tuesday 7%
Wednesday 14%
Thursday 9%
Friday 37%
Saturday 22%
- X
Expert Solution
This question has been solved!
Explore an expertly crafted, step-by-step solution for a thorough understanding of key concepts.
Step by stepSolved in 2 steps

Knowledge Booster
Recommended textbooks for you
 Glencoe Algebra 1, Student Edition, 9780079039897...AlgebraISBN:9780079039897Author:CarterPublisher:McGraw Hill
 Holt Mcdougal Larson Pre-algebra: Student Edition...AlgebraISBN:9780547587776Author:HOLT MCDOUGALPublisher:HOLT MCDOUGAL
 Big Ideas Math A Bridge To Success Algebra 1: Stu...AlgebraISBN:9781680331141Author:HOUGHTON MIFFLIN HARCOURTPublisher:Houghton Mifflin Harcourt

Glencoe Algebra 1, Student Edition, 9780079039897...
Algebra
ISBN:9780079039897
Author:Carter
Publisher:McGraw Hill

Holt Mcdougal Larson Pre-algebra: Student Edition...
Algebra
ISBN:9780547587776
Author:HOLT MCDOUGAL
Publisher:HOLT MCDOUGAL

Big Ideas Math A Bridge To Success Algebra 1: Stu...
Algebra
ISBN:9781680331141
Author:HOUGHTON MIFFLIN HARCOURT
Publisher:Houghton Mifflin Harcourt
