MATLAB: An Introduction with Applications
6th Edition
ISBN: 9781119256830
Author: Amos Gilat
Publisher: John Wiley & Sons Inc
expand_more
expand_more
format_list_bulleted
Question

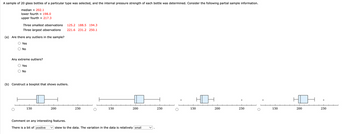
Transcribed Image Text:A sample of 20 glass bottles of a particular type was selected, and the internal pressure strength of each bottle was determined. Consider the following partial sample information.
median = 202.1
lower fourth = 198.0
upper fourth = 217.3
Three smallest observations 125.2 188.5 194.3
Three largest observations
(a) Are there any outliers in the sample?
○ Yes
No
221.6 231.2 250.1
Any extreme outliers?
Yes
No
(b) Construct a boxplot that shows outliers.
*
*
150
200
250
150
200
250
150
200
250
150
200
250
Comment on any interesting features.
There is a bit of positive ✓ skew to the data. The variation in the data is relatively small
Expert Solution
This question has been solved!
Explore an expertly crafted, step-by-step solution for a thorough understanding of key concepts.
Step by stepSolved in 2 steps with 10 images

Knowledge Booster
Similar questions
- Use the accompanying data set to complete the following actions. a. Find the quartiles. b. Find the interquartile range. c. Identify any outliers. 61 62 61 56 64 56 62 57 60 58 60 54 58 56 76 a. Find the quartiles. The first quartile, Q₁₁1 is The second quartile, Q₂, is The third quartile, Q3, is (Type integers or decimals.)arrow_forward1. The following are the ages of 16 randomly selected SCC students:16, 18, 18, 19, 20, 20, 21, 22, 23, 24, 24, 25, 28, 31, 35, 41(a) Find the median and the two quartiles.(b) Use the IQR method to find all outliers.(c) Draw the box plot.(d) Construct a frequency histogram with 5 classes of equal width.(e) Based on (c) or (d), do you expect the median or the mean to be greater? Why?arrow_forwardSuppose that a set of ten measurements is drawn randomly. The sample consists of the set {1,1,0,15,2,3,4,0,1,3}. By inspection it is evident that the measurement x=15 appears unusually large in comparison to the rest of the measurements. Calculate the z-score equivalent for the measurement x=15 and determine if it is an outlier.arrow_forward
- The table provides the number of Facebookfriends for a sample of 50 people aged 18to 25.a) Determine the percentiles for each of theNumber of Friends intervals.b) Determine the quartiles and theinterquartile range.c) Make a box and whisker plot.d) Determine whether there are any outliers.arrow_forwardIdentify all possible outliers from the following data set:0.145.24.756.1517.23.97.8arrow_forwardThe following describes a sample. The information given includes the five number summary, the sample size, and the largest and smallest data values in the tails of the distribution. Five number summary: (31, 61, 67, 69, 88); n = 120 Tails: 31, 52, 54, 56, 57,..., 77, 78, 84, 85, 88 Clearly identify any outliers using the IQR method. Select all that apply. No outliers 31 52 54 56 SE 57 77 78 84arrow_forward
arrow_back_ios
arrow_forward_ios
Recommended textbooks for you
 MATLAB: An Introduction with ApplicationsStatisticsISBN:9781119256830Author:Amos GilatPublisher:John Wiley & Sons Inc
 Probability and Statistics for Engineering and th...StatisticsISBN:9781305251809Author:Jay L. DevorePublisher:Cengage Learning
 Statistics for The Behavioral Sciences (MindTap C...StatisticsISBN:9781305504912Author:Frederick J Gravetter, Larry B. WallnauPublisher:Cengage Learning
 Elementary Statistics: Picturing the World (7th E...StatisticsISBN:9780134683416Author:Ron Larson, Betsy FarberPublisher:PEARSON
 The Basic Practice of StatisticsStatisticsISBN:9781319042578Author:David S. Moore, William I. Notz, Michael A. FlignerPublisher:W. H. Freeman
 Introduction to the Practice of StatisticsStatisticsISBN:9781319013387Author:David S. Moore, George P. McCabe, Bruce A. CraigPublisher:W. H. Freeman

MATLAB: An Introduction with Applications
Statistics
ISBN:9781119256830
Author:Amos Gilat
Publisher:John Wiley & Sons Inc

Probability and Statistics for Engineering and th...
Statistics
ISBN:9781305251809
Author:Jay L. Devore
Publisher:Cengage Learning

Statistics for The Behavioral Sciences (MindTap C...
Statistics
ISBN:9781305504912
Author:Frederick J Gravetter, Larry B. Wallnau
Publisher:Cengage Learning

Elementary Statistics: Picturing the World (7th E...
Statistics
ISBN:9780134683416
Author:Ron Larson, Betsy Farber
Publisher:PEARSON

The Basic Practice of Statistics
Statistics
ISBN:9781319042578
Author:David S. Moore, William I. Notz, Michael A. Fligner
Publisher:W. H. Freeman

Introduction to the Practice of Statistics
Statistics
ISBN:9781319013387
Author:David S. Moore, George P. McCabe, Bruce A. Craig
Publisher:W. H. Freeman