MATLAB: An Introduction with Applications
6th Edition
ISBN: 9781119256830
Author: Amos Gilat
Publisher: John Wiley & Sons Inc
expand_more
expand_more
format_list_bulleted
Question

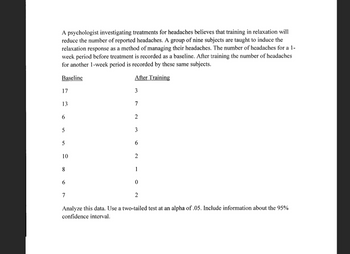
Transcribed Image Text:A psychologist investigating treatments for headaches believes that training in relaxation will
reduce the number of reported headaches. A group of nine subjects are taught to induce the
relaxation response as a method of managing their headaches. The number of headaches for a 1-
week period before treatment is recorded as a baseline. After training the number of headaches
for another 1-week period is recorded by these same subjects.
Baseline
After Training
17
3
13
7
6
2
5
3
5
6
10
2
8
1
6
0
7
2
Analyze this data. Use a two-tailed test at an alpha of .05. Include information about the 95%
confidence interval.

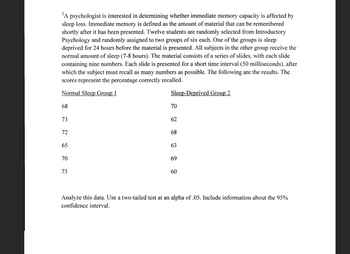
Transcribed Image Text:2A psychologist is interested in determining whether immediate memory capacity is affected by
sleep loss. Immediate memory is defined as the amount of material that can be remembered
shortly after it has been presented. Twelve students are randomly selected from Introductory
Psychology and randomly assigned to two groups of six each. One of the groups is sleep
deprived for 24 hours before the material is presented. All subjects in the other group receive the
normal amount of sleep (7-8 hours). The material consists of a series of slides, with each slide
containing nine numbers. Each slide is presented for a short time interval (50 milliseconds), after
which the subject must recall as many numbers as possible. The following are the results. The
scores represent the percentage correctly recalled.
Normal Sleep Group 1
68
73
72
65
70
73
223 22
Sleep-Deprived Group 2
70
62
68
63
69
60
Analyze this data. Use a two-tailed test at an alpha of .05. Include information about the 95%
confidence interval.
Expert Solution
This question has been solved!
Explore an expertly crafted, step-by-step solution for a thorough understanding of key concepts.
Step by stepSolved in 2 steps with 3 images

Knowledge Booster
Similar questions
- See below.arrow_forwardI need the right answer for a and b.arrow_forwardDetermine whether the study depicts an observational study or an experiment. A scientist was studying the effects of a new fertilizer on crop yield. She randomly assigned half of the plots on a farm to group one and the remaining plots to group two. On the plots in group one, the new fertilizer was used for a year. On the plots in group two, the old fertilizer was used. At the end of the year the average crop yield for the plots in group one was compared with the average crop yield for the plots in group two.arrow_forward
- A researcher thinks some social media sites are more prone to narcissistic behavior (excessive posting) than others. To examine the relationship between narcissism and social media, she recruits users of three different social media sites (Facebook, Twitter and Instagram), follows them for 24 hours and records the number of posts made by each user. The number of posts is given in the table below. Twitter Facebook Instagram 10 7 14 10 8. 10 10 10 11 9. www. 12 wwww. 11 13 12 8. 7 8. 11 8 10 12 11 11 a. Perform a complete hypothesis test to determine whether there are any significant differences among the three groups. Test at the .05 level of significance. SHOW ALL YOUR WORK b. Do you need to perform post hocs? Explain but do not compute the post hocs. C. Compute effect size. d. Summarize your findings in a source table. e. Write an interpretation of our results in APA-format (include means and SDs in your interpretation)arrow_forwardIn addition to therapy, anti-depressant drugs are used in the treatment of depression. The data below are from a study comparing two anti-depressant drugs. A baseline measurement for symptomatic behavior for depression is taken. After treatment with medication, another measurement taken. The data given in the table is for improvement which is for the reduction in symptomatic behavior.arrow_forwardI have attached the picture for review. Please answer section A, B, C.arrow_forward
- Suppose you pulled info regarding the sex of the victim and offender for murders in the United States. The data look something like this: Sex of Vic. Sex of Off. F M F 124 421 M 1609 3725 Assume that the sex of the victim is the response variable. What is the relative risk of being killed by female offender for male victims?arrow_forwardA psychologist believed that as children get older, they engage in more “inactive activities” such as playing computer games, watching TV and surfing the internet. She collected data from 10 children. She recorded the age of each child and the amount of activity (in hours) the child engaged in per week. Age Activity 7 4.3 9 3.2 10 1 13 1.5 12 1.2 15 0.8 9 3 12 4 15 1.5 14 1.9 Using excel, obtain a scatterplot of the data. Discuss the relationship between age and activity based on the scatterplot. Using excel, obtain the simple linear regression linear regression line predicting activity from age. Interpret the intercept and slope of the regression line. By hand, predict the amount of activity for age = 14. By hand, calculate the residual for age = 14 Using excel output, test the null hypothesis that the slope coefficient is zero using the p-value approach. Write one sentence interpreting the meaning of this result. Make sure to report the test statistic…arrow_forwardElaine is interested in determining if men are more satisfied in their jobs than women in the healthcare industry. She administers a job satisfaction questionnaire to 20 men and 20 women working in hospital administration. Her grouping variable is gender and dependent variable is job satisfaction. The job satisfaction scale consists of 8 items measured using a 5-point rating scale. A higher score on this scale would indicate high job satisfaction. The maximum score that can be obtained on the scale is 40. We can assume that job satisfaction scores are normally distributed. Use the appropriate T test with a significance level of 0.05 to test the hypothesis. Research Question Do the mean job satisfaction scores differ for men and women working in the hospital administration department? Hypothesis The mean job satisfaction scores do not differ for men and women working in the hospital administration department. Compute an independent sample t test on these data. Report…arrow_forward
- Melinda thinks that stress might predict lower grades on a statistics final exam. She gives a sample of statistics students a questionaire and then looks for relationships between their answers and their final exam scores. Although she finds no support for her original hypothesis, she does find that the the numbers of hours that students work outside of school is related to exam performance. When she reports the results of her study, she presents them as if the relationship between number of hours worked and exam performance was her original hypothesis. This is a questionable research practice known as: a. open science b. p-hacking c. HARKing d. constraints of generalityarrow_forwardSee below.arrow_forward
arrow_back_ios
arrow_forward_ios
Recommended textbooks for you
 MATLAB: An Introduction with ApplicationsStatisticsISBN:9781119256830Author:Amos GilatPublisher:John Wiley & Sons Inc
 Probability and Statistics for Engineering and th...StatisticsISBN:9781305251809Author:Jay L. DevorePublisher:Cengage Learning
 Statistics for The Behavioral Sciences (MindTap C...StatisticsISBN:9781305504912Author:Frederick J Gravetter, Larry B. WallnauPublisher:Cengage Learning
 Elementary Statistics: Picturing the World (7th E...StatisticsISBN:9780134683416Author:Ron Larson, Betsy FarberPublisher:PEARSON
 The Basic Practice of StatisticsStatisticsISBN:9781319042578Author:David S. Moore, William I. Notz, Michael A. FlignerPublisher:W. H. Freeman
 Introduction to the Practice of StatisticsStatisticsISBN:9781319013387Author:David S. Moore, George P. McCabe, Bruce A. CraigPublisher:W. H. Freeman

MATLAB: An Introduction with Applications
Statistics
ISBN:9781119256830
Author:Amos Gilat
Publisher:John Wiley & Sons Inc

Probability and Statistics for Engineering and th...
Statistics
ISBN:9781305251809
Author:Jay L. Devore
Publisher:Cengage Learning

Statistics for The Behavioral Sciences (MindTap C...
Statistics
ISBN:9781305504912
Author:Frederick J Gravetter, Larry B. Wallnau
Publisher:Cengage Learning

Elementary Statistics: Picturing the World (7th E...
Statistics
ISBN:9780134683416
Author:Ron Larson, Betsy Farber
Publisher:PEARSON

The Basic Practice of Statistics
Statistics
ISBN:9781319042578
Author:David S. Moore, William I. Notz, Michael A. Fligner
Publisher:W. H. Freeman

Introduction to the Practice of Statistics
Statistics
ISBN:9781319013387
Author:David S. Moore, George P. McCabe, Bruce A. Craig
Publisher:W. H. Freeman