
MATLAB: An Introduction with Applications
6th Edition
ISBN: 9781119256830
Author: Amos Gilat
Publisher: John Wiley & Sons Inc
expand_more
expand_more
format_list_bulleted
Related questions
Question
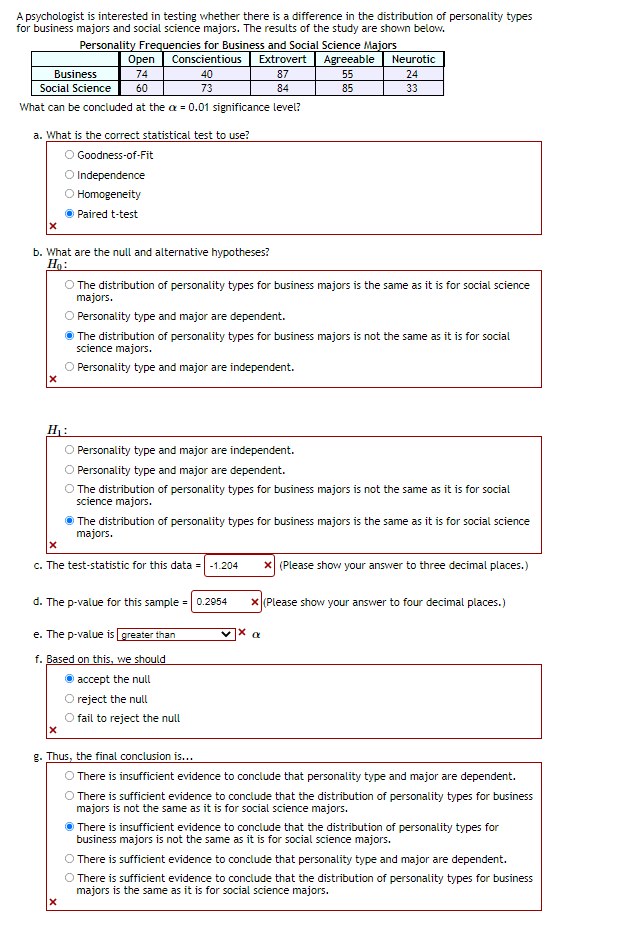

Transcribed Image Text:A psychologist is interested in testing whether there is a difference in the distribution of personality types
for business majors and social science majors. The results of the study are shown below.
Personality Frequencies for Business and Social Science Majors
Conscientious
Оpen
Extrovert Agreeable
Neurotic
Business
74
40
87
55
24
Social Science
60
73
84
85
33
What can be concluded at the a = 0.01 significance level?
a. What is the correct statistical test to use?
O Goodness-of-Fit
O Independence
O Homogeneity
Paired t-test
b. What are the null and alternative hypotheses?
Hn:
O The distribution of personality types for business majors is the same as it is for social science
majors.
O Personality type and major are dependent.
The distribution of personality types for business majors is not the same as it is for social
science majors.
O Personality type and major are independent.
H:
O Personality type and major are independent.
Personality type and major are dependent.
The distribution of personality types for business majors is not the same as it is for social
science majors.
The distribution of personality types for business majors is the same as it is for social science
majors.
c. The test-statistic for this data = -1.204
x| (Please show your answer to three decimal places.)
d. The p-value for this sample = 0.2954
x (Please show your answer to four decimal places.)
e. The p-value is preater than
f. Based on this, we should
accept the null
O reject the null
fail to reject the null
g. Thus, the final conclusion is...
There is insufficient evidence to conclude that personality type and major are dependent.
O There is sufficient evidence to conclude that the distribution of personality types for business
majors is not the same as it is for social science majors.
There is insufficient evidence to conclude that the distribution of personality types for
business majors is not the same as it is for social science majors.
O There is sufficient evidence to conclude that personality type and major are dependent.
O There is sufficient evidence to conclude that the distribution of personality types for business
majors is the same as it is for social science majors.
Expert Solution
This question has been solved!
Explore an expertly crafted, step-by-step solution for a thorough understanding of key concepts.

This is a popular solution

Trending nowThis is a popular solution!

Step by stepSolved in 6 steps

Knowledge Booster

Similar questions
- A researcher is interested in investigating whether the military branch a person signs up for and the person's blood type are dependent. The table below shows the results of a survey. Frequencies of Military Branch and Blood Type A AB Аrmy Navy 140 60 41 30 111 81 67 26 Air Force 124 51 46 21 Marines 118 88 67 27 What can be concluded at the a = 0.01 significance level? a. What is the correct statistical test to use? O Paired t-test O Goodness-of-Fit O Homogeneity O Independence b. What are the null and alternative hypotheses? H,: O Blood type and branch of the military are dependent. O The distribution of blood types is the same for each branch of the military. O Blood type and branch of the military are independent. O The distribution of blood types is not the same for each branch of the military. H : O The distribution of blood types is not the same for each branch of the military. O The distribution of blood types is the same for each branch of the military. O Blood type and branch…arrow_forward3arrow_forwardState the conclusion for the test. Give reason for your answer.arrow_forward
- Perform the hypothesis test that there is a relationship between gender and major 4) at 5% level of significance using the information from the sample below. Math Major English Major Total Male 42 72 114 30 72 09 132 06 204 Female Totalarrow_forwardJustice in the Courts? In an issue of Parade Magazine, the editors reported on a national survey on law and order. One question asked of the 2512 U.S. adults who took part was whether they believed that juries “almost always” convict the guilty and free the innocent. Only 578 said that they did. At the 5% significance level, do the data provide sufficient evidence to conclude that less than one in four Americans believe that juries “almost always” convict the guilty and free the innocent?arrow_forwardI need help figuring out parts c and darrow_forward
- Need C and Darrow_forward12.arrow_forwardC. Predicting Student Success STA believes there is a relationship between high school GPA (on a four-point scale) and college performance (as measured by GPA on a four-point scale). The following data were randomly selected from among students enrolling Fall 2020. HS GPA STA GPA Student 1 HS GPA STAGPA Student 21 2.9 2.5 3.6 3.4 2 3.4 3.1 3.0 22 3.4 4.0 1.7 3 3.1 23 2.9 2.9 1.7 3.0 3.2 3.3 4 24 3.5 5 3.4 25 4.0 3.6 3.6 3.0 26 3.6 3.8 3.2 3.9 3.1 27 8. 4.0 3.9 28 3.4 3.6 3.2 9. 3.0 3.0 29 3.7 10 2.9 2.0 3.0 30 4.0 3.3 4.0 3.2 11 3.3 31 12 3.6 3.8 32 3.7 3.2 3.4 3.0 13 3.7 3.9 33 14 3.8 3.6 34 2.5 2.0 15 2.5 2.5 35 2.9 2.9 3.7 2.2 16 2.9 2.5 36 3.8 17 2.8 2.1 37 2.9 18 3.8 1.7 3.5 38 3.6 3.5 3.6 19 3.7 39 3.6 20 3.9 3.0 40 3.1 3.6 How confident should St. Mary's be regarding the accuracy of their predictions? Why?arrow_forward
- C. Predicting Student Success STA believes there is a relationship between high school GPA (on a four-point scale) and college performance (as measured by GPA on a four-point scale). The following data were randomly selected from among students enrolling Fall 2020. HS GPA STA GPA Student 1 HS GPA STAGPA Student 21 2.9 2.5 3.6 3.4 2 3.4 3.1 3.0 22 3.4 4.0 1.7 3 3.1 23 2.9 2.9 1.7 3.0 3.2 3.3 4 24 3.5 5 3.4 25 4.0 3.6 3.6 3.0 26 3.6 3.8 3.2 3.9 3.1 27 8. 4.0 3.9 28 3.4 3.6 3.2 9. 3.0 3.0 29 3.7 10 2.9 2.0 3.0 30 4.0 3.3 4.0 3.2 11 3.3 31 12 3.6 3.8 32 3.7 3.2 3.4 3.0 13 3.7 3.9 33 14 3.8 3.6 34 2.5 2.0 15 2.5 2.5 35 2.9 2.9 3.7 2.2 16 2.9 2.5 36 3.8 17 2.8 2.1 37 2.9 18 3.8 1.7 3.5 38 3.6 3.5 3.6 19 3.7 39 3.6 20 3.9 3.0 40 3.1 3.6 Is high school GPA a good predictor of STA GPA? Why? What STA GPA would you predict for a student with a high school GPA of 3.75? How you would make the prediction.arrow_forwardA researcher is interested in investigating whether religious affiliation and the brand of sneakers that people wear are associated. The table below shows the results of a survey. Frequencies of Religions and Sneakers Other Nike Adidas Protestant 95 83 100 Catholic 68 69 93 Jewish 15 23 26 Other 76 81 94 What can be concluded at the a = 0.10 significance level? a. What is the correct statistical test to use? Independence Homogeneity Goodness-of-Fit Paired t-test b. What are the null and alternative hypotheses? Но: Sneaker brand and religious affiliation are dependent. The distribution of sneaker brand is not the same for each religion. Sneaker brand and religious affiliation are independent. The distribution of sneaker brand is the same for each religion. H1: Sneaker brand and religious affiliation are independent. The distribution of sneaker brand is the same for each religion. The distribution of sneaker brand is not the same for each religion. O Sneaker brand and religious…arrow_forwardIn an interview for a job, the interviewer says that the average annual income of the company's 16 employees is $73,610. The actual annual incomes of the 16 employees are shown below. Which measure of central tendency would be most informative to the potential employee? OOO O O median O mode O mean Orange $12,500 $12,500 $16,430 $17,305 $17,408 $18,980 $20,432 $24,540 $25,676 $28,906 $28,956 $32,654 $94,024 $98,213 $250,921 $478,320arrow_forward
arrow_back_ios
SEE MORE QUESTIONS
arrow_forward_ios
Recommended textbooks for you
- MATLAB: An Introduction with ApplicationsStatisticsISBN:9781119256830Author:Amos GilatPublisher:John Wiley & Sons Inc
 Probability and Statistics for Engineering and th...StatisticsISBN:9781305251809Author:Jay L. DevorePublisher:Cengage Learning
 Statistics for The Behavioral Sciences (MindTap C...StatisticsISBN:9781305504912Author:Frederick J Gravetter, Larry B. WallnauPublisher:Cengage Learning
  Elementary Statistics: Picturing the World (7th E...StatisticsISBN:9780134683416Author:Ron Larson, Betsy FarberPublisher:PEARSON
 The Basic Practice of StatisticsStatisticsISBN:9781319042578Author:David S. Moore, William I. Notz, Michael A. FlignerPublisher:W. H. Freeman
 Introduction to the Practice of StatisticsStatisticsISBN:9781319013387Author:David S. Moore, George P. McCabe, Bruce A. CraigPublisher:W. H. Freeman
MATLAB: An Introduction with Applications
Statistics
ISBN:9781119256830
Author:Amos Gilat
Publisher:John Wiley & Sons Inc
Probability and Statistics for Engineering and th...
Statistics
ISBN:9781305251809
Author:Jay L. Devore
Publisher:Cengage Learning
Statistics for The Behavioral Sciences (MindTap C...
Statistics
ISBN:9781305504912
Author:Frederick J Gravetter, Larry B. Wallnau
Publisher:Cengage Learning
Elementary Statistics: Picturing the World (7th E...
Statistics
ISBN:9780134683416
Author:Ron Larson, Betsy Farber
Publisher:PEARSON
The Basic Practice of Statistics
Statistics
ISBN:9781319042578
Author:David S. Moore, William I. Notz, Michael A. Fligner
Publisher:W. H. Freeman
Introduction to the Practice of Statistics
Statistics
ISBN:9781319013387
Author:David S. Moore, George P. McCabe, Bruce A. Craig
Publisher:W. H. Freeman