MATLAB: An Introduction with Applications
6th Edition
ISBN: 9781119256830
Author: Amos Gilat
Publisher: John Wiley & Sons Inc
expand_more
expand_more
format_list_bulleted
Topic Video
Question
thumb_up100%

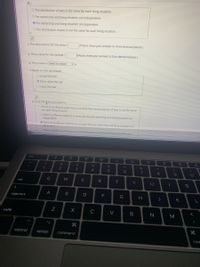
Transcribed Image Text:O The distribution of pets is the same for each IlvIng sltuatlon.
O Pet ownership and living situation are independent.
Pet ownership and Ilving sltuatlon are dependent.
O The distribution of pets is nOt the same for each living situation.
C The test-statistic for this data =
(Please show your answer to three decimal places.)
d. The p-value for this sample =
(Please show your answer to four decimal places.)
e. The p-value is Select an answer
1. Based on this, we should
O accept the null
O fall to reject the null
O reject the null
g Thus, the final conclusion is..
O There is insufficient evidence to conclude that the distribution of pets is not the same
for each living situation.
O There is sufficient evidence to conclude that pet ownership and living situation are
independent.
• There is Insufficlent evidence to conclude that pet ownership and living situation are
dependent
O There is sulticient culdence to conclude that pet ownbrahip and living sitution are
esc
388
FS
%23
%24
2
3
4
9
Q
W
E
RI
Y
tab
caps lock
F
G
H
K
C
V
N
く
shift
M
control
option
command
co
つ
つ
B

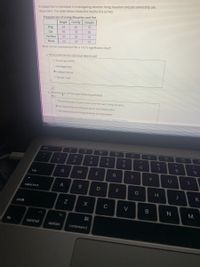
Transcribed Image Text:A researcher is interested in investigating whether living situation and pet Ownership are
dependent. The table below shows the results of a survey.
Frequencles of Lİving Situation and Pet
Single Family Couple
78
Dog
94
83
Cat
96
78
95
40
58
54
Various
None
53
58
53
What can be concluded at the a = 0.10 significance level?
a. What is the correct statistical test to use?
O Goodness-of-Fit
O Homogenelty
® Independence
O Paired t-test
b. What are the null and alternative hypotheses?
Ho:
O The distribution of pets is he same for each living situation.
Pet ownership and living situation are independent.
O Pet ownership and living situation are dependent.
OThe distribution of pets is not the same for each living situation.
esc
%23
24
2
&
4.
8
Q
W
tab
T
Y
U
caps lock
A
S
shift
C
fn
control
option
command
Expert Solution
This question has been solved!
Explore an expertly crafted, step-by-step solution for a thorough understanding of key concepts.
Step by stepSolved in 2 steps with 2 images

Knowledge Booster
Learn more about
Need a deep-dive on the concept behind this application? Look no further. Learn more about this topic, statistics and related others by exploring similar questions and additional content below.Similar questions
- Here are the reading scores (out of 60) of 20 randomly selected kindergarten kids in a district 34, 26, 46, 46, 43, 42, 45, 39, 43, 32, 15, 36, 29, 39, 41, 27, 38, 58, 31, 35 Find the 5-number summary for the data set. Min: 15 Q1: OF 58 Find the IQR of the data set. IQR: 11.7 x Find Q3+1.5(IQR).! Q3+1.5(IQR) = 60.6 X Median: 38.5 38.5 Q3: 43 043 Max: 58 Are there any high outliers, that is, are there any numbers in the data set higher than Q3+1.5(IQR)? No, there are no high outliers ✓ OB Find Q₁-1.5(IQR). Q₁-1.5(IQR) Are there any low outliers, that is, are there any numbers in the data set higher than Q₁— 1.5(IQR)? No, there are no low outliers ✓ = 25.3 Xarrow_forwardThe data to the right represent the number of chocolate chips per cookie in a random sample of a name brand and a store brand. Complete parts (a) to (c) below.. 10 N (a) Draw side-by-side boxplots for each brand of cookie. Label the boxplots "N" for the name brand and "S" for the store brand. Choose the correct answer below. OA. OB. O C. C N I 10 on he Full data set Name Brand Store Brand 26 23 32 28 33 15 29 22 31 21 17 27 23 35 25 28 19 26 23 22 28 24 24 24 22 28 +arrow_forwardEach of the 5 cats in a pet store was weighed. Here are their weights (in pounds). 13, 12, 5, 12, 9 Find the median and mean weights of these cats. If necessary, round your answers to the nearest tenth. (a) Median: pounds X Ś ? (b) Mean: poundsarrow_forward
- Derrick is preparing to submit his taxes. Over the year, he kept track of certain deductions he is able to claim (all rounded to the nearest dollar). These values are given below. 65,144,97,144,103,98,101,127,58,151 He wants to create a histogram of the data using 4 classes. What values of Xscl, Xmin, and Xmax should he use?arrow_forwardI need help with 5 a,b,carrow_forwardDo men take less time than women to get out of bed in the morning? The 42 men observed averaged 7.6 minutes to get out of bed after the alarm rang. Their standard deviation was 2.2. The 52 women observed averaged 9 minutes and their standard deviation was 2.1 minutes. What can be concluded at the a = :0.01 %3D level of significance?arrow_forward
- Determine if the data set is a population or a sample. The incomes of every employee at an amusement park.arrow_forwardhelparrow_forwardThe following are the distances (in miles) to the nearest airport for 13 families. 9, 10, 16, 24, 27, 30, 31, 34, 37, 41, 41, 46, 47 Notice that the numbers are ordered from least to greatest. Give the median, lower quartile, and upper quartile for the data set.arrow_forward
- A student’s test grades are: 85, 75, 100, 90, and 90. On the two questions below, round to the nearest whole number when relevant. Show calculations and clearly report answers to each of the two questions below. a. What is the mean, or average, test grade for this student? b. What is the median test grade?arrow_forwardWhich of the following is a sample and not a population? People who live in your town People who respond to a national survey Patients admitted to Roper Hospital during March of 2006 Sixth grade boys attending Mount Hope elementary school.arrow_forwardSample # 1 and has been provided in the second screenshot (hand written)arrow_forward
arrow_back_ios
SEE MORE QUESTIONS
arrow_forward_ios
Recommended textbooks for you
 MATLAB: An Introduction with ApplicationsStatisticsISBN:9781119256830Author:Amos GilatPublisher:John Wiley & Sons Inc
 Probability and Statistics for Engineering and th...StatisticsISBN:9781305251809Author:Jay L. DevorePublisher:Cengage Learning
 Statistics for The Behavioral Sciences (MindTap C...StatisticsISBN:9781305504912Author:Frederick J Gravetter, Larry B. WallnauPublisher:Cengage Learning
 Elementary Statistics: Picturing the World (7th E...StatisticsISBN:9780134683416Author:Ron Larson, Betsy FarberPublisher:PEARSON
 The Basic Practice of StatisticsStatisticsISBN:9781319042578Author:David S. Moore, William I. Notz, Michael A. FlignerPublisher:W. H. Freeman
 Introduction to the Practice of StatisticsStatisticsISBN:9781319013387Author:David S. Moore, George P. McCabe, Bruce A. CraigPublisher:W. H. Freeman

MATLAB: An Introduction with Applications
Statistics
ISBN:9781119256830
Author:Amos Gilat
Publisher:John Wiley & Sons Inc

Probability and Statistics for Engineering and th...
Statistics
ISBN:9781305251809
Author:Jay L. Devore
Publisher:Cengage Learning

Statistics for The Behavioral Sciences (MindTap C...
Statistics
ISBN:9781305504912
Author:Frederick J Gravetter, Larry B. Wallnau
Publisher:Cengage Learning

Elementary Statistics: Picturing the World (7th E...
Statistics
ISBN:9780134683416
Author:Ron Larson, Betsy Farber
Publisher:PEARSON

The Basic Practice of Statistics
Statistics
ISBN:9781319042578
Author:David S. Moore, William I. Notz, Michael A. Fligner
Publisher:W. H. Freeman

Introduction to the Practice of Statistics
Statistics
ISBN:9781319013387
Author:David S. Moore, George P. McCabe, Bruce A. Craig
Publisher:W. H. Freeman