
MATLAB: An Introduction with Applications
6th Edition
ISBN: 9781119256830
Author: Amos Gilat
Publisher: John Wiley & Sons Inc
expand_more
expand_more
format_list_bulleted
Related questions
Question
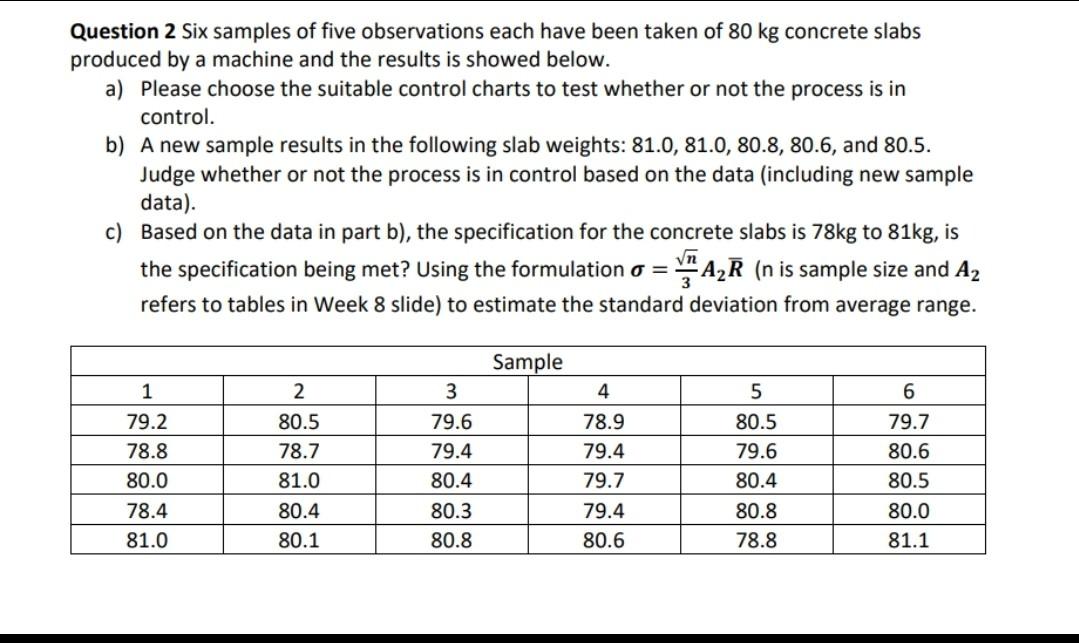

Transcribed Image Text:Question 2 Six samples of five observations each have been taken of 80 kg concrete slabs
produced by a machine and the results is showed below.
a) Please choose the suitable control charts to test whether or not the process is in
control.
b) A new sample results in the following slab weights: 81.0, 81.0, 80.8, 80.6, and 80.5.
Judge whether or not the process is in control based on the data (including new sample
data).
c) Based on the data in part b), the specification for the concrete slabs is 78kg to 81kg, is
the specification being met? Using the formulation o=A₂R (n is sample size and A2
refers to tables in Week 8 slide) to estimate the standard deviation from average range.
1
79.2
78.8
80.0
78.4
81.0
2
80.5
78.7
81.0
80.4
80.1
3
79.6
79.4
80.4
80.3
80.8
Sample
4
78.9
79.4
79.7
79.4
80.6
5
80.5
79.6
80.4
80.8
78.8
6
79.7
80.6
80.5
80.0
81.1
Expert Solution
This question has been solved!
Explore an expertly crafted, step-by-step solution for a thorough understanding of key concepts.

Step by stepSolved in 3 steps with 3 images

Knowledge Booster

Similar questions
- 4. Determine percentage of weight for age; height for age; head circumference for age; and the IBW for 9 months girl who is 72 cm in length; weight of 18.2#; and head circumference of 51 cmarrow_forward1. Calculate the water content (% by weight) of the sample.arrow_forwardConsider the set of data given below 0, 1, 2, 4, 5, 5, 7, 10, 10, 12, 13, 17, 39 A.) Find the quartiles for the above data set B) Find the IQR C)Determine if the data has any outliersarrow_forward
- B) For each sample, plot the data points on a scatter plot (by hand without drawing the line of best fit) and ensure to add the appropriate labels on the plotarrow_forwardConsider these sample data: x1=15, x2=9, x3=3, x4=22. a. Find n. b. Compute ∑xi. c.Determine x. a.n=arrow_forwardFind each of the following, rounded to the nearest tenth, if necessary, for the given set of data: 63, 78, 81, 82 a) range: b) mean: c) median: d) standard deviation: e) draw a box and whisker plot (we will look at your work):arrow_forward
- A study is run to estimate the mean total cholesterol level in children 2 to 6 years of age. A sample of 9 participants is selected and their total cholesterol levels are measured as follows. 180 220 240 196 175 183 195 140 200 What is the sample mean? A) 196 B) 200 C) 192.11 D) 180arrow_forwardThe data below lists states poverty rate, gun deaths per 100,000 people, high school graduation rate and the unemployment rate. Use a 2x2 contingency table for questions 1-3. Use the median to divide each list into 2 groups. 1) Test for independence between poverty rate and gun deaths. 2) Test for independence between high school graduation rate and gun deaths. 3) Test for independence between unemployment and gun deaths. 4) Divide the data into 3 groups by gun deaths: 0-9, 9.1-12 and 12.1-20. Use ANOVA to test the claim that the average poverty rate is the same for the three groups. Be sure to write down the mean and standard deviation for each group. 0-9 9.1-12 12.1-20 n = x = s = n = x = s = n = x = s =arrow_forwardThe distribution of hemoglobin in grams per deciliter of blood if approximately N(14,1) in women and approximately N(16,1) in men. Use software or Table B to find the answers. A) What percent of women have more hemoglobin than the men's mean hemoglobin? B) What percent of men have less hemoglobin than the women's mean hemoglobin? C) What percent of men have more hemoglobin than the women's mean hemoglobin?arrow_forward
arrow_back_ios
arrow_forward_ios
Recommended textbooks for you
- MATLAB: An Introduction with ApplicationsStatisticsISBN:9781119256830Author:Amos GilatPublisher:John Wiley & Sons Inc
 Probability and Statistics for Engineering and th...StatisticsISBN:9781305251809Author:Jay L. DevorePublisher:Cengage Learning
 Statistics for The Behavioral Sciences (MindTap C...StatisticsISBN:9781305504912Author:Frederick J Gravetter, Larry B. WallnauPublisher:Cengage Learning
  Elementary Statistics: Picturing the World (7th E...StatisticsISBN:9780134683416Author:Ron Larson, Betsy FarberPublisher:PEARSON
 The Basic Practice of StatisticsStatisticsISBN:9781319042578Author:David S. Moore, William I. Notz, Michael A. FlignerPublisher:W. H. Freeman
 Introduction to the Practice of StatisticsStatisticsISBN:9781319013387Author:David S. Moore, George P. McCabe, Bruce A. CraigPublisher:W. H. Freeman
MATLAB: An Introduction with Applications
Statistics
ISBN:9781119256830
Author:Amos Gilat
Publisher:John Wiley & Sons Inc
Probability and Statistics for Engineering and th...
Statistics
ISBN:9781305251809
Author:Jay L. Devore
Publisher:Cengage Learning
Statistics for The Behavioral Sciences (MindTap C...
Statistics
ISBN:9781305504912
Author:Frederick J Gravetter, Larry B. Wallnau
Publisher:Cengage Learning
Elementary Statistics: Picturing the World (7th E...
Statistics
ISBN:9780134683416
Author:Ron Larson, Betsy Farber
Publisher:PEARSON
The Basic Practice of Statistics
Statistics
ISBN:9781319042578
Author:David S. Moore, William I. Notz, Michael A. Fligner
Publisher:W. H. Freeman
Introduction to the Practice of Statistics
Statistics
ISBN:9781319013387
Author:David S. Moore, George P. McCabe, Bruce A. Craig
Publisher:W. H. Freeman