
MATLAB: An Introduction with Applications
6th Edition
ISBN: 9781119256830
Author: Amos Gilat
Publisher: John Wiley & Sons Inc
expand_more
expand_more
format_list_bulleted
Related questions
Question
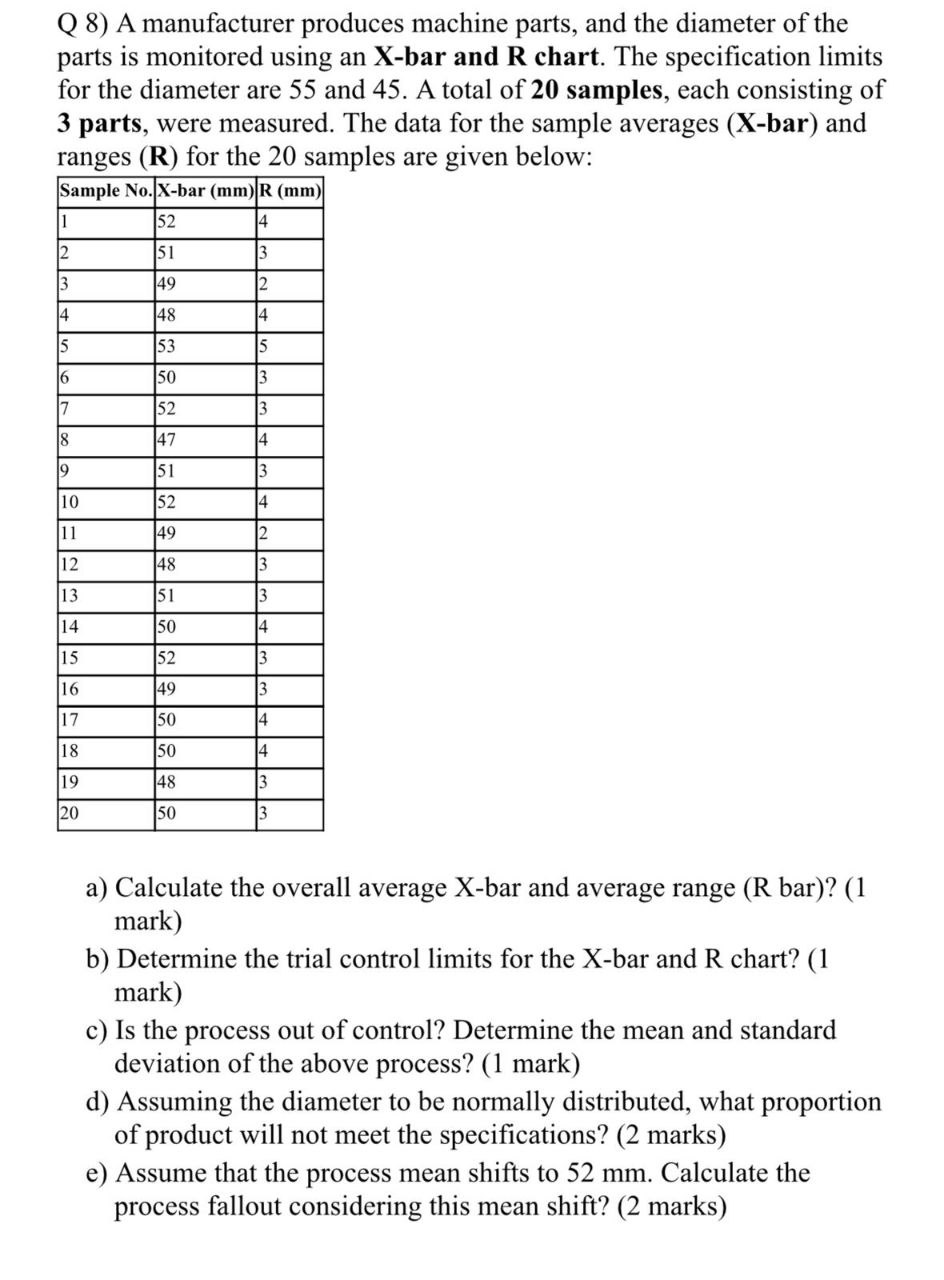

Transcribed Image Text:Q8) A manufacturer produces machine parts, and the diameter of the
parts is monitored using an X-bar and R chart. The specification limits
for the diameter are 55 and 45. A total of 20 samples, each consisting of
3 parts, were measured. The data for the sample averages (X-bar) and
ranges (R) for the 20 samples are given below:
Sample No. X-bar (mm) R (mm)
1
52
4
2
51
3
3
49
2
4
48
4
15
53
5
16
50
3
7
52
3
18
47
4
19
51
3
10
52
14
11
49
2
12
48
3
13
51
3
14
50
4
15
52
3
16
49
17
50
4
18
50
14
19
48
3
20
50
a) Calculate the overall average X-bar and average range (R bar)? (1
mark)
b) Determine the trial control limits for the X-bar and R chart? (1
mark)
c) Is the process out of control? Determine the mean and standard
deviation of the above process? (1 mark)
d) Assuming the diameter to be normally distributed, what proportion
of product will not meet the specifications? (2 marks)
e) Assume that the process mean shifts to 52 mm. Calculate the
process fallout considering this mean shift? (2 marks)
Expert Solution
This question has been solved!
Explore an expertly crafted, step-by-step solution for a thorough understanding of key concepts.

Step by stepSolved in 2 steps

Knowledge Booster

Similar questions
- Draw a box plot for the following data: Median: 4.5 Lowest Value: 1 Greatest Value: 9 Lower Quartile: 2.5 Interquartile Range: 6 8 10arrow_forward34arrow_forwardTo reduce bias, one should a. get a better instrument b. take the average of several measurements c. use rate rather than a count d. unbias your resultsarrow_forward
- Given the data set : 7,19,8,1,30,43,14,6,40 Identify the flowing values that would be used when creating the box plot Highest: Upper quartile: Median : Lower quartile: Lowestarrow_forwardAnswer Carrow_forwardFahrenheit is the measurement of temperature commonly used in the US. On the Fahrenheit scale, water freezes at 32 F and boils at 212 F (at sea level). What is the data type and measurement scale of a dataset that records Fahrenheit temperature? a. Numerical and ratio b. Numerical and interva c. Categorical and ratio d. Categorical and ordinalarrow_forward
- Determine which of the four levels of measurement ( norminal, ordinal, interval, ratio) is most appropriate for the data below. Years in which U.S. presidents were inauguratedarrow_forwardThe densities of several common metals are shown in the following table. Metal Density (g/cm³) iron 7.87 silver 10.49 lead 11.36 zinc 7.13 aluminum 2.70 For her chemistry lab, Kamila needs to identify three metal samples by density. The data she collected is shown in the following table. The metal samples are all rectangular prisms.arrow_forwardIf we measure the variable "race" using the five primary categories used by the U.S. Census (White, Black/African American, American Indian/Alaska Native, Asian, and Native Hawaiian/Other Pacific Islander), then the level of measurement in this case is: Select one: 1.Interval/Ratio 2. Ordinal 3. Nominalarrow_forward
arrow_back_ios
arrow_forward_ios
Recommended textbooks for you
- MATLAB: An Introduction with ApplicationsStatisticsISBN:9781119256830Author:Amos GilatPublisher:John Wiley & Sons Inc
 Probability and Statistics for Engineering and th...StatisticsISBN:9781305251809Author:Jay L. DevorePublisher:Cengage Learning
 Statistics for The Behavioral Sciences (MindTap C...StatisticsISBN:9781305504912Author:Frederick J Gravetter, Larry B. WallnauPublisher:Cengage Learning
  Elementary Statistics: Picturing the World (7th E...StatisticsISBN:9780134683416Author:Ron Larson, Betsy FarberPublisher:PEARSON
 The Basic Practice of StatisticsStatisticsISBN:9781319042578Author:David S. Moore, William I. Notz, Michael A. FlignerPublisher:W. H. Freeman
 Introduction to the Practice of StatisticsStatisticsISBN:9781319013387Author:David S. Moore, George P. McCabe, Bruce A. CraigPublisher:W. H. Freeman
MATLAB: An Introduction with Applications
Statistics
ISBN:9781119256830
Author:Amos Gilat
Publisher:John Wiley & Sons Inc
Probability and Statistics for Engineering and th...
Statistics
ISBN:9781305251809
Author:Jay L. Devore
Publisher:Cengage Learning
Statistics for The Behavioral Sciences (MindTap C...
Statistics
ISBN:9781305504912
Author:Frederick J Gravetter, Larry B. Wallnau
Publisher:Cengage Learning
Elementary Statistics: Picturing the World (7th E...
Statistics
ISBN:9780134683416
Author:Ron Larson, Betsy Farber
Publisher:PEARSON
The Basic Practice of Statistics
Statistics
ISBN:9781319042578
Author:David S. Moore, William I. Notz, Michael A. Fligner
Publisher:W. H. Freeman
Introduction to the Practice of Statistics
Statistics
ISBN:9781319013387
Author:David S. Moore, George P. McCabe, Bruce A. Craig
Publisher:W. H. Freeman