
FINANCIAL ACCOUNTING
10th Edition
ISBN: 9781259964947
Author: Libby
Publisher: MCG
expand_more
expand_more
format_list_bulleted
Related questions
Concept explainers
Topic Video
Question
thumb_up100%
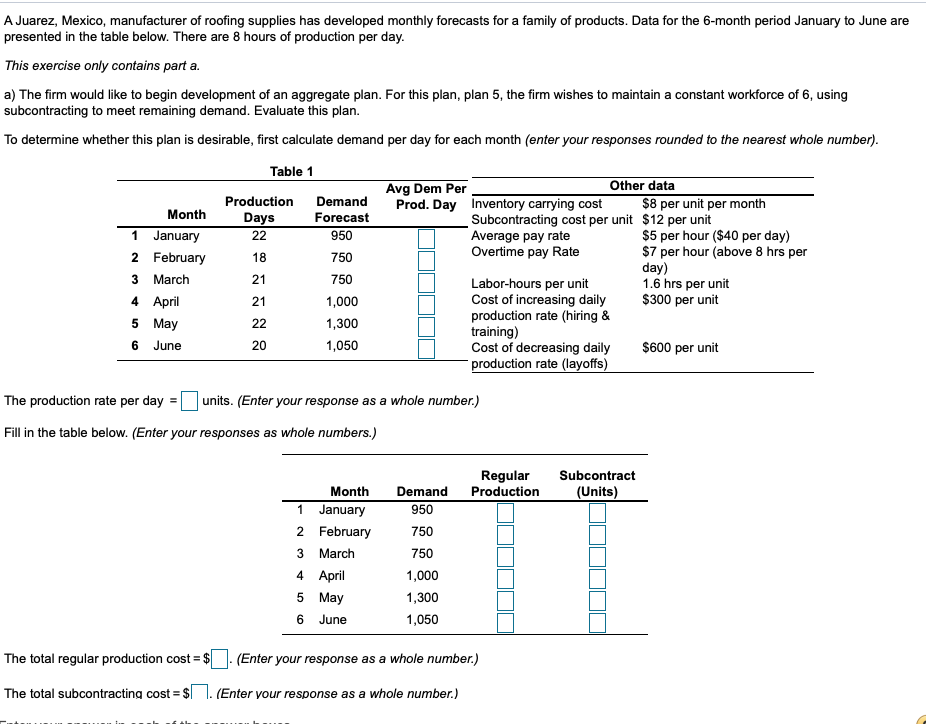

Transcribed Image Text:A Juarez, Mexico, manufacturer of roofing supplies has developed monthly forecasts for a family of products. Data for the 6-month period January to June are
presented in the table below. There are 8 hours of production per day.
This exercise only contains part a.
a) The firm would like to begin development of an aggregate plan. For this plan, plan 5, the firm wishes to maintain a constant workforce of 6, using
subcontracting to meet remaining demand. Evaluate this plan.
To determine whether this plan is desirable, first calculate demand per day for each month (enter your responses rounded to the nearest whole number).
Table 1
Avg Dem Per
Prod. Day Inventory carrying cost
Other data
Production
Demand
$8 per unit per month
Month
Days
Forecast
Subcontracting cost per unit $12 per unit
Average pay rate
Overtime pay Rate
$5 per hour ($40 per day)
$7 per hour (above 8 hrs per
day)
1.6 hrs per unit
$300 per unit
1 January
22
950
2 February
18
750
з March
21
750
Labor-hours per unit
Cost of increasing daily
production rate (hiring &
training)
Cost of decreasing daily
production rate (layoffs)
4 April
21
1,000
5 May
22
1,300
June
20
1,050
$600 per unit
The production rate per day
units. (Enter your response as a whole number.)
%3D
Fill in the table below. (Enter your responses as whole numbers.)
Regular
Production
Subcontract
Month
Demand
(Units)
1
January
950
2 February
750
March
750
4 April
1,000
5 May
1,300
June
1,050
The total regular production cost = $
(Enter your response as a whole number.)
The total subcontracting cost = $
(Enter your response as a whole number.)
Expert Solution
This question has been solved!
Explore an expertly crafted, step-by-step solution for a thorough understanding of key concepts.

This is a popular solution

Trending nowThis is a popular solution!

Step by stepSolved in 3 steps

Knowledge Booster


Learn more about
Need a deep-dive on the concept behind this application? Look no further. Learn more about this topic, accounting and related others by exploring similar questions and additional content below.Similar questions
- NuFloor Manufacturing produces floor tiles. The managers at NuFloor are trying to develop budgets for the upcoming quarter. The following data have been gathered for a particular tile design. Projected unit sales 3,600 cases Selling price per case $ 200 Inventory at the beginning of the quarter 600 cases Target inventory at the end of the quarter 800 cases Direct labor hours needed to produce one case 0.40 hours Direct labor wages $ 15 per hour Direct material cost per case $ 16 Variable manufacturing overhead cost per case $ 10 Fixed overhead costs for the upcoming quarter $ 319,200arrow_forwardPauline Found Manufacturing, Inc., is moving to kanbans to support its telephone switching-board assembly lines. Determine the size of the kanban for subassemblies and the number of kanbans needed. Setup cost Annual holding cost Daily production Annual usage Lead time Safety stock $30 $120 per subassembly 25 subassemblies 4,000 (50 weeks x 5 days each x daily usage of 16 subassemblies) 12 days 4 days' productionarrow_forwardA UAE based company of Solar Panel supplies has developed monthly forecasts for a family of products. Data for the 6-month period January to June and cost information are presented in the tables 1and 2 below. Use Plan 2-by using subcontractors with constant workforce at lowest demand per day and calculate Total Cost of the Plan. Table 1 PRODUCTION DEMAND DAYS FORECAST DEMAND PER DAY 22 1,073 18 903 1,000 1,000 1,272 1,388 29 $ per unit 95 per hour ( Working hours per day) 1.6 hours per unit MONTH Jan Feb Mar Apr May June Table 2 Cost Information Subcontracting cost per unit Average pay rate Labor-hours to produce a unt 21 24 24 22 2arrow_forward
- Rowe Tool and Die (RTD) produces metal fittings as a supplier to various manufacturing firms in the area. The following is the forecasted income statement for the next quarter, which is the typical planning horizon used at RTD. RTD expects to sell 45,000 units during the quarter. RTD carries no inventories. Amount Per Unit Sales revenue $ 1,170,000 $ 26.00 Costs of fitting produced 900,000 20.00 Gross profit $ 270,000 $ 6.00 Administrative costs 207,000 4.60 Operating profit $ 63,000 $ 1.40 Fixed costs included in this income statement are $292,500 for depreciation on plant and machinery and miscellaneous factory operations and $94,500 for administrative costs. RTD has received a request for 10,000 fittings to be produced in the next quarter from Endicott Manufacturing. Endicott has never purchased from RTD, although they have been a local company for many years. Endicott has offered to pay $20 per unit. RTD can easily produce the 10,000 units with its existing…arrow_forwardHickory Manufacturing Company forecasts the following demand for a product (in thousands of units) over the next five years. 1 2 3 4 5 76 79 82 82 55 Year Forecast demand Currently the manufacturer has eight machines that operate on a two-shift (eight hours each) basis. Thirty days per year are available for scheduled maintenance of equipment with no process output. Assume there are 250 workdays in a year. Each manufactured good takes 25 minutes to produce. a. What is the effective capacity of the factory? Round your answer down to the nearest whole number. units/year b. Given the five-year forecast, how much extra capacity is needed each year? Use a minus sign to enter an answer, if there is excess capacity. Round your answers to the nearest whole number. Year Extra capacity needed (units) c. Does the firm need to buy more machines? If so, how many? When? If your answer is zero, enter "0". Round your answers up to the nearest whole number. Year Additional machines needed 1 1 2 2 3 3 4…arrow_forwardSuppose plant capacity were only 13,000 pieces instead of 15,000 pieces each month. Thespecial order must either be taken in full or be rejected completely. Should Carilla accept thespecial order? Show your calculationsarrow_forward
- Rowe Tool and Die (RTD) produces metal fittings as a supplier to various manufacturing firms in the area. The following is the forecasted income statement for the next quarter, which is the typical planning horizon used at RTD. RTD expects to sell 45,000 units during the quarter. RTD carries no inventories. Amount Per Unit Sales revenue $ 1,170,000 $ 26.00 Costs of fitting produced 900,000 20.00 Gross profit $ 270,000 $ 6.00 Administrative costs 207,000 4.60 Operating profit $ 63,000 $ 1.40 Fixed costs included in this income statement are $292,500 for depreciation on plant and machinery and miscellaneous factory operations and $94,500 for administrative costs. RTD has received a request for 10,000 fittings to be produced in the next quarter from Endicott Manufacturing. Endicott has never purchased from RTD, although they have been a local company for many years. Endicott has offered to pay $20 per unit. RTD can easily produce the 10,000 units with its existing…arrow_forwardA producer of felt-tip pens has received a forecast of demand of 31,000 pens for the coming month from its marketing department. Fixed costs of $21,000 per month are allocated to the felt-tip operation, and variable costs are 25 cents per pen. a. Find the break-even quantity if-pens sell for $1 each. (Round your answer to the next whole number.) QBEP Answer is complete and correct. Price 28,000 units b. At what price must pens be sold to obtain a monthly profit of $18,000, assuming that estimated demand materializes? (Round your answer to 2 decimal places.) X Answer is not complete.arrow_forwardI need some help with this problemarrow_forward
- Suppose a company has 1,000 units of a raw material part on hand. If 750 of these units are routed into production, should the company place an order to stock up on more of these parts? (Show calculations). Determine the economic order quantity (EOQ) for this part, assuming the following:The company plans to use 10,000 units during the coming year.The company orders this part in lots of 1,000 units, and each order placed carries a processing cost of $2.50.Each unit of inventory carries an annual holding cost of $6.40.arrow_forward3) Ehrlich Manufacturing Corporation manufactures and sells wooden puzzles. Expected puzzle sales at Ehrlich (in units) for the next three months are as follows: January February March budgeted unit sales: 27,000 25,000 30,000 Ehrlich likes to maintain a finished goods inventory equal to 30% of the next month's estimated sales. How many puzzles should Ehrlich plan on producing during the month of February? Show your calculations.arrow_forwardEliot Sprinkler Systems produces equipment for lawn irrigation. One of the parts used in selected Eliot equipment is a specialty nozzle. The budgeting team is now determining the purchase requirements and monthly cash disbursements for this part. Eliot wishes to have in stock enough nozzles to use for the coming month. On August 1, the company has 16,800 nozzles in stock, although the latest estimate for August production indicates a requirement for only 15,000 nozzles. Total uses of the nozzle are expected to be 14,700 in September and 15,540 in October. Nozzles are purchased at a wholesale price of $8. Eliot pays 25 percent of the purchase price in cash in the month when the parts are delivered. The remaining 75 percent is paid in the following month. Eliot purchased 21,000 parts in July. Required: a. Estimate purchases of the nozzle (in units) for August and September. b. Estimate the cash disbursements for nozzles in August and September.arrow_forward
arrow_back_ios
SEE MORE QUESTIONS
arrow_forward_ios
Recommended textbooks for you
 AccountingAccountingISBN:9781337272094Author:WARREN, Carl S., Reeve, James M., Duchac, Jonathan E.Publisher:Cengage Learning,
 Accounting Information SystemsAccountingISBN:9781337619202Author:Hall, James A.Publisher:Cengage Learning,
 Horngren's Cost Accounting: A Managerial Emphasis...AccountingISBN:9780134475585Author:Srikant M. Datar, Madhav V. RajanPublisher:PEARSON
 Intermediate AccountingAccountingISBN:9781259722660Author:J. David Spiceland, Mark W. Nelson, Wayne M ThomasPublisher:McGraw-Hill Education
 Financial and Managerial AccountingAccountingISBN:9781259726705Author:John J Wild, Ken W. Shaw, Barbara Chiappetta Fundamental Accounting PrinciplesPublisher:McGraw-Hill Education
Accounting
Accounting
ISBN:9781337272094
Author:WARREN, Carl S., Reeve, James M., Duchac, Jonathan E.
Publisher:Cengage Learning,
Accounting Information Systems
Accounting
ISBN:9781337619202
Author:Hall, James A.
Publisher:Cengage Learning,
Horngren's Cost Accounting: A Managerial Emphasis...
Accounting
ISBN:9780134475585
Author:Srikant M. Datar, Madhav V. Rajan
Publisher:PEARSON
Intermediate Accounting
Accounting
ISBN:9781259722660
Author:J. David Spiceland, Mark W. Nelson, Wayne M Thomas
Publisher:McGraw-Hill Education
Financial and Managerial Accounting
Accounting
ISBN:9781259726705
Author:John J Wild, Ken W. Shaw, Barbara Chiappetta Fundamental Accounting Principles
Publisher:McGraw-Hill Education