MATLAB: An Introduction with Applications
6th Edition
ISBN: 9781119256830
Author: Amos Gilat
Publisher: John Wiley & Sons Inc
expand_more
expand_more
format_list_bulleted
Question

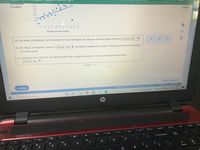
Transcribed Image Text:AllempL. T Or
entertainment
(in dollars)
35+
30-
Xx
25
Español
20+
X x
15-
10-
4.
10
12
14
16
18
20
22
Number of hours worked
(a) For these 24 students, as the number of hours increases, the amount of money spent tends to (Choose one)
5 ?
(b) For these 24 students, there is (Choose one) v correlation between the number of hours worked and the amount
of money spent.
(c) Using the line of best fit, we would predict that a student working 8 hours would spend approximately
(Choose one) ▼
Submit Assignment
Continue
Terms of Use Privacy Center Accessibity
448 PM
5/5/2022
0 2022 McGraw H LLC A Rights Reserved.
73°F Partly sunny
O E n0
O Type here to search
hp
home
end
delete
ort sc
144
num
lock
backsppace
esc
&
9
8
2$
6
@
2
%23
3
home
国口 国

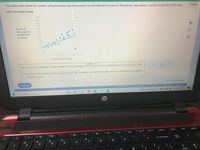
Transcribed Image Text:The scatter plot shows the number of hours worked and money spent on entertainment by each of 24 students. Also shown is the line of best fit for the data.
Español
Fill in the blanks below.
70
65-
60-
55-
Amount of
50-
money spent on
45-
40-
**
entertainment
(in dollars)
35-
30+
25
20-
15
10-
10
12
14
16
18
20
Number of hours worked
(a) For these 24 students, as the number of hours increases, the amount of money sper> tends to (Choose one)
(b) For these 24 students, there is (Choose one) v correlation between the number of hours worked and the amount
of money spent.
Continue
Submit Assignment
O 2022 McGrmw HI LLC. All Rights Reserved Terms of Use Privacy Center Accessibnity
448 PM
5/5/2022
O Type here to search
D.
73°F Partly sunny
bp
home
and
Dg up
"prt sc
delete
ho
e 10
4+
esc
num
&
7
+ backspace
lock
#3
%23
8
9
2
4.
6
1
3
P
home
国口 回
Expert Solution
This question has been solved!
Explore an expertly crafted, step-by-step solution for a thorough understanding of key concepts.
This is a popular solution
Trending nowThis is a popular solution!
Step by stepSolved in 2 steps

Knowledge Booster
Similar questions
- 2.arrow_forwardSuppose that you are interested in the relationship between Reading and Writing scores. (a) Provide the scatterplot for the association between Reading and Writing scores. Based on the scatterplot, do you expect Reading to be correlated with Writing? If so, based only on the plot, would you expect the correlation to be positive or negative? Explain your answer. (b) Report the value of the correlation between Reading and Writing scores, and whether it is statistically significant. Do these results agree with your expectations from part (a)? RDG WRTG 34 44 47 36 42 59 39 41 36 49 50 46 63 65 44 52 47 41 44 50 50 62 44 41 47 40 42 59 42 41 47 41 60 65 39 49 57 54 73 65 47 46 39 44 35 39 39 41 48 49 31 41 52 63 47 54 36 44 47 44 34 46 52 57 42 40 37 44 44 33 71 58 47 46 42 33 42 36 47 41 52 54 52 54 39 39 31 41 60 54 47 31 39 28 42 36 47 57 42 49 36 41 50 33 34 34 55 55 28 46…arrow_forwardSuppose that there is a correlation of r= 0.41 between the amount of time that each student reports studying for an exam and the student's grade on the exam. This correlation would mean that there is a tendency for people who study more to get better grades.arrow_forward
- A researcher found the correlation between math ability and math anxiety is -0.6. Which of the following is NOT correct? The people who have lower math ability tend to have higher math anxiety. The people who have higher math ability tend to have lower math anxiety. Student A has high math anxiety is because she/he has a low math abilityarrow_forwardChoose the value of the Pearson's Correlation Coefficient (r) that best describes the two plots. : 0.504, II: -0.232. 2) I: -0.904, II: 0.232. 3) I: 0.904, II: -0.232. 4) I: -0.232, II: 1.304. 5) I: 0.904, II: -0.632.arrow_forwardTrue or False: If the correlation coefficient from two variables X and Y , the number of shark attacks and number of iced lemonade sales, respectively, is r= 0.98, we can conclude that an increase in iced lemonade sales causes an increase in shark attacks.arrow_forward
- While performing searches on the Internet to find accommodation, Jasmine realized that the cost of a housing unit seems to be related to the number of inhabitants of the municipality where the unit is located. She noted the following data. She represented the data in a scatter plot, where she drew a line of best fit passing through the mean point of the distribution. If Jasmine considers that a linear correlation exists between these two variables, what should be the mean monthly rent of a 4½-room unit in a municipality with a population of approximately 250 000? Justify your answer algebraically.arrow_forwardA linear model was fit to predict weekly Sales of frozen pizza (in pounds) from the average Price ($/unit) charged by a sample of stores in a city in 39 weeks over a three -year period. The average Sales were 63, 200 pounds (SD = 10, 670 pounds), and the correlation between Price and Sales was -0.529. If the Price in a particular week was two SD higher than the mean Price, how much pizza would you predict was sold that week?arrow_forwardA researcher measures GPA and height for a group of high school students. What kind of correlation is likely to be obtained for these two variables?arrow_forward
- If you have 10 variables when computing correlation coefficients how many unique coefficients will you have overall?arrow_forward10) The top point in the scatter plot (6.5, 1459) is for Washington, DC. Find the predicted DC violent crime rate if x=6.5. Then find the residual for DC using the predicted violence crime rate and the actual violent crime rate (the actual crime rate is provided in the first sentence of this question). Prediction = Actual y-value = Residual =arrow_forwarde. Compute the covariance and correlation coefficient r between the right tire pressure. f. How do you know the relationship between pressure in the left and right tires is positive. g. What value would a correlation coefficient (r) be close to if there was no (linear) relationship between the 2 tire pressures?arrow_forward
arrow_back_ios
SEE MORE QUESTIONS
arrow_forward_ios
Recommended textbooks for you
 MATLAB: An Introduction with ApplicationsStatisticsISBN:9781119256830Author:Amos GilatPublisher:John Wiley & Sons Inc
 Probability and Statistics for Engineering and th...StatisticsISBN:9781305251809Author:Jay L. DevorePublisher:Cengage Learning
 Statistics for The Behavioral Sciences (MindTap C...StatisticsISBN:9781305504912Author:Frederick J Gravetter, Larry B. WallnauPublisher:Cengage Learning
 Elementary Statistics: Picturing the World (7th E...StatisticsISBN:9780134683416Author:Ron Larson, Betsy FarberPublisher:PEARSON
 The Basic Practice of StatisticsStatisticsISBN:9781319042578Author:David S. Moore, William I. Notz, Michael A. FlignerPublisher:W. H. Freeman
 Introduction to the Practice of StatisticsStatisticsISBN:9781319013387Author:David S. Moore, George P. McCabe, Bruce A. CraigPublisher:W. H. Freeman

MATLAB: An Introduction with Applications
Statistics
ISBN:9781119256830
Author:Amos Gilat
Publisher:John Wiley & Sons Inc

Probability and Statistics for Engineering and th...
Statistics
ISBN:9781305251809
Author:Jay L. Devore
Publisher:Cengage Learning

Statistics for The Behavioral Sciences (MindTap C...
Statistics
ISBN:9781305504912
Author:Frederick J Gravetter, Larry B. Wallnau
Publisher:Cengage Learning

Elementary Statistics: Picturing the World (7th E...
Statistics
ISBN:9780134683416
Author:Ron Larson, Betsy Farber
Publisher:PEARSON

The Basic Practice of Statistics
Statistics
ISBN:9781319042578
Author:David S. Moore, William I. Notz, Michael A. Fligner
Publisher:W. H. Freeman

Introduction to the Practice of Statistics
Statistics
ISBN:9781319013387
Author:David S. Moore, George P. McCabe, Bruce A. Craig
Publisher:W. H. Freeman