
MATLAB: An Introduction with Applications
6th Edition
ISBN: 9781119256830
Author: Amos Gilat
Publisher: John Wiley & Sons Inc
expand_more
expand_more
format_list_bulleted
Related questions
Question
thumb_up100%
#29). Due to bartleby’s guidelines my tutor didn’t finish my problem. So please do the ones that are blank.
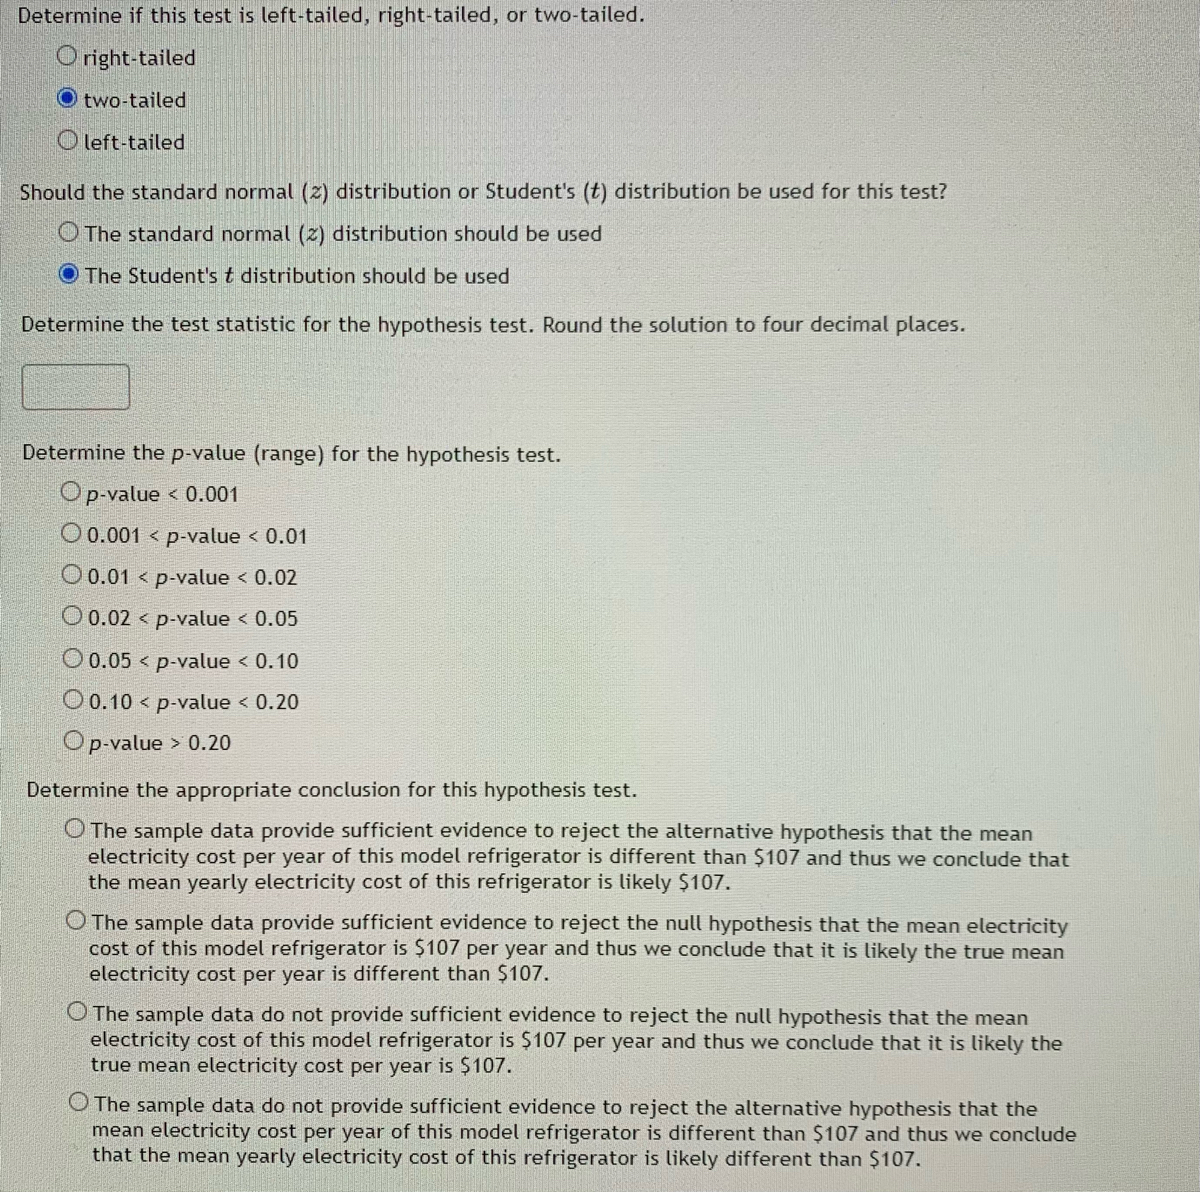

Transcribed Image Text:Determine if this test is left-tailed, right-tailed, or two-tailed.
Oright-tailed
two-tailed
O left-tailed
Should the standard normal (z) distribution or Student's (t) distribution be used for this test?
O The standard normal (2) distribution should be used
O The Student's t distribution should be used
Determine the test statistic for the hypothesis test. Round the solution to four decimal places.
Determine the p-value (range) for the hypothesis test.
Op-value
< 0.001
O 0.001 < p-value < 0.01
O 0.01 < p-value < 0.02
O 0.02 < p-value < 0.05
O 0.05 < p-value < 0.10
O 0.10 < p-value < 0.20
Op-value > 0.20
Determine the appropriate conclusion for this hypothesis test.
O The sample data provide sufficient evidence to reject the alternative hypothesis that the mean
electricity cost per year of this model refrigerator is different than $107 and thus we conclude that
the mean yearly electricity cost of this refrigerator is likely $107.
O The sample data provide sufficient evidence to reject the null hypothesis that the mean electricity
cost of this model refrigerator is $107 per year and thus we conclude that it is likely the true mean
electricity cost per year is different than $107.
O The sample data do not provide sufficient evidence to reject the null hypothesis that the mean
electricity cost of this model refrigerator is $107 per year and thus we conclude that it is likely the
true mean electricity cost per year is $107.
O The sample data do not provide sufficient evidence to reject the alternative hypothesis that the
mean electricity cost per year of this model refrigerator is different than $107 and thus we conclude
that the mean yearly electricity cost of this refrigerator is likely different than $107.

Transcribed Image Text:The Energy Star rating system is an energy efficiency program run by the U.S. Environmental Protection
Agency (EPA). Energy Star certified appliances, such as televisions and refrigerators, are rated in regard to
their average energy consumption per year.
A certain brand of Energy Star certified refrigerator is stated to have a mean yearly electricity cost of
$107. A consumer advocacy organization believes that this claim is wrong, that the energy consumption of
this particular refrigerator is different than $107 per year. The group collected a random sample of 18
refrigerators of the model in question and had each lab-tested for electricity consumption. The yearly
energy consumption of each is given below.
106.72
107.8
106.38
107.1
107.82
106.39
106.39
106.71
107.53
107.03
106.73
106.84
107.73
106.67
106.63
107.38
106.67
106.29
Using a significance level of 0.1%, test the hypothesis that the average yearly electricity consumption of
the refrigerator in question is different than $107 per year. Assume that the distribution of all electricity
costs of this model of refrigerator is approximately normally distributed. Use the p-value method.
State the null and alternative hypothesis for this test.
Ho: p = v| 107
107
Determine if this test is left-tailed, right-tailed, or two-tailed.
O right-tailed
O two-tailed
O left-tailed
Should the standard normal (z) distribution or Student's (t) distribution be used for this test?
O The standard normal (z) distribution should be used
O The Student's t distribution should be used
Determine the test statistic for the hypothesis test. Round the solution to four decimal places.
Determine the p-value (range) for the hypothesis test.
Op-value < 0.001
O 0.001 < p-value < 0.01
O 0.01 < p-value < 0.02
O0.02 < p-value < 0.05
O0.05 < p-value < 0.10
O 0.10 < p-value < 0.20
Expert Solution
This question has been solved!
Explore an expertly crafted, step-by-step solution for a thorough understanding of key concepts.

This is a popular solution

Trending nowThis is a popular solution!

Step by stepSolved in 2 steps

Knowledge Booster

Similar questions
- B) If y= x+3 x-2 22. ydyarrow_forward3. The distance between city A and city B is 38 miles; city A's population is 100,000, city B's is 250,000. How far is the point of indifference from city B?arrow_forward19) Under normal conditions, Jacob's Jetta can go 600 miles on a full tank (15 gallons) and 280 miles on 7 gallons. Express the distance, d, Jacob can drive in terms of the amount of gasoline g he buys. 20) A WKRP in Cincinnati, Ohio reports the high and low temperatures in the area as 59 F and 23°F, respectively. A station in Windsor, Ontario reports the same temperatures as 15°C and-5°C. Express the Fahrenheit temperature, F, in terms of the Celsius temperature C.arrow_forward
- Please Solve In 15mins I will Thumbs-uparrow_forwardJordan and Amari run a 200-meter race, and Jordan wins by 13 meters. They decide to run the 200-meter race again with Jordan starting 13 meters behind the starting line. Find the correct answer to each of the following parts (a) through (d). O A. Jordan wins the second race because Jordan can run a longer distance in a longer amount time. O B. Amari wins the second race because Amari has a shorter distance to run. O C. Amari wins the second race because Jordan is not fast enough to be able to catch up in time. OD. Jordan wins the second race because Jordan can run a longer distance in a shorter amount of time. b. Suppose Jordan starts 8 meters behind the starting line in the second race. Who wins the race? O A. Amari wins the second race because Amari has a shorter distance to run. O B. Jordan wins the second race because Jordan can run faster than Amari. O C. Amari wins the second race because Jordan is not fast enough to be able to catch up in time. O D. Jordan wins the second race…arrow_forward10. The basketball coach is refurbishing the outdoor courts at his school and is wondering if the goals are at the regulation height. The regulation height is 10 feet, measured from the ground to the rim. One afternoon the gym teacher, who is 6 feet tall, measured his own shadow at 5 feet long. he measured the shadow of the basketball goal (to the rim) as 8 feet long. Use this information to determine if the basketball goal is at the regulation height. Use a similarity proportion to solve for the height of the basketball hoop/rim. The actual height of the rim is feet (round to the tenth place). The rim (does or does not) meet regulation height since the required height is feet.arrow_forward
arrow_back_ios
arrow_forward_ios
Recommended textbooks for you
- MATLAB: An Introduction with ApplicationsStatisticsISBN:9781119256830Author:Amos GilatPublisher:John Wiley & Sons Inc
 Probability and Statistics for Engineering and th...StatisticsISBN:9781305251809Author:Jay L. DevorePublisher:Cengage Learning
 Statistics for The Behavioral Sciences (MindTap C...StatisticsISBN:9781305504912Author:Frederick J Gravetter, Larry B. WallnauPublisher:Cengage Learning
  Elementary Statistics: Picturing the World (7th E...StatisticsISBN:9780134683416Author:Ron Larson, Betsy FarberPublisher:PEARSON
 The Basic Practice of StatisticsStatisticsISBN:9781319042578Author:David S. Moore, William I. Notz, Michael A. FlignerPublisher:W. H. Freeman
 Introduction to the Practice of StatisticsStatisticsISBN:9781319013387Author:David S. Moore, George P. McCabe, Bruce A. CraigPublisher:W. H. Freeman
MATLAB: An Introduction with Applications
Statistics
ISBN:9781119256830
Author:Amos Gilat
Publisher:John Wiley & Sons Inc
Probability and Statistics for Engineering and th...
Statistics
ISBN:9781305251809
Author:Jay L. Devore
Publisher:Cengage Learning
Statistics for The Behavioral Sciences (MindTap C...
Statistics
ISBN:9781305504912
Author:Frederick J Gravetter, Larry B. Wallnau
Publisher:Cengage Learning
Elementary Statistics: Picturing the World (7th E...
Statistics
ISBN:9780134683416
Author:Ron Larson, Betsy Farber
Publisher:PEARSON
The Basic Practice of Statistics
Statistics
ISBN:9781319042578
Author:David S. Moore, William I. Notz, Michael A. Fligner
Publisher:W. H. Freeman
Introduction to the Practice of Statistics
Statistics
ISBN:9781319013387
Author:David S. Moore, George P. McCabe, Bruce A. Craig
Publisher:W. H. Freeman