A First Course in Probability (10th Edition)
10th Edition
ISBN: 9780134753119
Author: Sheldon Ross
Publisher: PEARSON
expand_more
expand_more
format_list_bulleted
Question

Transcribed Image Text:**Part 2.**
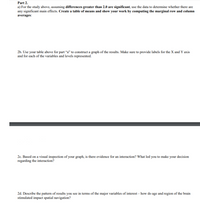
a) For the study above, assuming **differences greater than 2.0 are significant**, use the data to determine whether there are any significant main effects. **Create a table of means and show your work by computing the marginal row and column averages:**
---
2b. Use your table above for part “a” to construct a graph of the results. Make sure to provide labels for the X and Y axis and for each of the variables and levels represented.
---
2c. Based on a visual inspection of your graph, is there evidence for an interaction? What led you to make your decision regarding the interaction?
---
2d. Describe the pattern of results you see in terms of the major variables of interest – how do age and region of the brain stimulated impact spatial navigation?

Transcribed Image Text:Hypothesis Testing
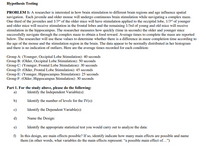
**PROBLEM 1:** A researcher is interested in how brain stimulation to different brain regions and age influence spatial navigation. Each juvenile and older mouse will undergo continuous brain stimulation while navigating a complex maze. One-third of the juveniles and \( \frac{1}{3} \) of the older mice will have stimulation applied to the occipital lobe, \( \frac{1}{3} \) of younger and older mice will receive stimulation in the frontal lobes and the remaining \( \frac{1}{3} \) of young and old mice will receive stimulation in the hippocampus. The researcher measures how quickly (time in seconds) the older and younger mice successfully navigate through the complex maze to obtain a food reward. Average times to complete the maze are reported below. The researcher will use these values to determine whether there is a difference in maze completion time according to the age of the mouse and the stimulation region in the brain. The data appear to be normally distributed in her histogram and there is no indication of outliers. Here are the average times recorded for each condition:
- **Group A** (Younger, Occipital Lobe Stimulation): 40 seconds
- **Group B** (Older, Occipital Lobe Stimulation): 50 seconds
- **Group C** (Younger, Frontal Lobe Stimulation): 30 seconds
- **Group D** (Older, Frontal Lobe Stimulation): 45 seconds
- **Group E** (Younger, Hippocampus Stimulation): 25 seconds
- **Group F** (Older, Hippocampus Stimulation): 30 seconds
**Part 1. For the study above, please do the following:**
a) **Identify the Independent Variable(s):**
b) **Identify the number of levels for the IV(s):**
c) **Identify the Dependent Variable(s):**
d) **Name the Design:**
e) **Identify the appropriate statistical test you would carry out to analyze the data:**
f) **In this design, are main effects possible? If so, identify indicate how many main effects are possible and name them (in other words, what variables do the main effects represent: “a possible main effect of…”)**
Expert Solution
This question has been solved!
Explore an expertly crafted, step-by-step solution for a thorough understanding of key concepts.
Step by stepSolved in 3 steps

Knowledge Booster
Similar questions
- Match the best graphic to be used for each scenario. To compare the choleterol levels between males and females v [ Chopse] box plot pie chart side by side box plot To display the breakdown of diet types (vegan, vegetarian, low carb, low fat)fat stem plot To describe the distribution of fasting blood [ Choose ] sugar levels among elderly diabetic patients To calculate the proportion of people in a study sample who weigh less than the [Choose] sample meanhah No new data to save. Last checked MacBook Airarrow_forward4.3) •VA report from Texas Transportation Institute (Texas A&M University System 2005) on Congestion Re- duction Strategies looked into the extra travel time (due to traffic congestion) for commute travel per traveler per year in hours for different urban areas. Below are the data for urban areas that had a population of over 3 million for the year 2002. Extra Hours per Traveler per Year Urban Area Los Angeles San Francisco 98 75 Washington DC Atlanta 66 64 Houston 65 Dallas, Fort Worth Chicago Detroit 61 55 54 Miami 48 Boston 53 New York 50 Phoenix 49 Philadelphia 40 4. Compute the mean and median values for extra travel hours. Based on the values of the mean and median, is the distribution of extra travel hours likely to be approximately symmetric, positively skewed, or negatively skewed?arrow_forwardThe trend of thinner beauty pageant winners has generated charges that the contest encourages unhealthy diet habits among young women. Listed below are body mass indexes (BMI) for beauty pageant winners from two different time periods. Find the coefficient of variation for each of the two sets of data, then compare the variation. The coefficient of variation for the BMI's of beauty pageant winners from the 1920s and 1930s is %arrow_forward
- L4Q2.Which one of the following scatter plots best describes the given data?arrow_forwardA back-to-back stem-and-leaf plot compares two data sets by using the same stems for each data set. Leaves for the first data set are on one side while leaves for the second data set are on the other side. The back-to-back stem- and-leaf plot available below shows the salaries (in thousands) of all lawyers at two small law firms. Complete parts (a) and (b) below. Click the icon to view the back-to-back stem-and-leaf plot. (a) What are the lowest and highest salaries at Law Firm A? at Law Firm B? How many lawyers are in each firm? At Law Firm A the lowest salary was $ At Law Firm B the lowest salary was $ and the highest salary was $ and the highest salary was $arrow_forwardUse the stem-and-leaf plot to list the actual data entries. What is the maximum data entry? What is the minimum data entry? Key: 2 | 7=27 27 3 2 4 1224779 5 011233 3 4 4 4 4 56 689 6 999 7 399 8 5 Choose the correct actual data entries below. O A. 27, 32, 41, 42, 42, 44, 47, 47, 49, 50, 51, 51, 52, 53, 53, 53, 54, 54, 54, 54, 55, 56, 56, 58, 59, 69, 69, 69, 73, 79, 79, 85 B. 27, 32, 41, 42, 44, 47, 49, 50, 51, 52, 53, 54, 55, 56, 58, 59, 69, 73, 79, 85 OC. 2.7, 3.2, 4.1, 4.2, 4.4, 4.7, 4.9, 5.0, 5.1, 5.2, 5.3, 5.4, 5.5, 5.6, 5.8, 5.9,6.9, 7.3, 7.9, 8.5 O D. 2.7, 3.2, 4.1, 4.2, 4.2, 4.4, 4.7, 4.7, 4.9, 5.0, 5.1, 5.1, 5.2, 5.3, 5.3, 5.3, 5.4, 5.4, 5.4, 5.4, 5.5, 5.6, 5.6, 5.8, 5.9, 6.9, 6.9, 6.9, 7.3, 7.9, 7.9, 8.5 The maximum data entry is The minimum data entry isarrow_forward
- (6) Below is the exam score for 11 students: 90, 83, 89, 66, 80, 87, 95, 94, 70, 92, 83 Construct a stem-and-leaf plot for the data set, using the tenth digit as the stem and the unit digit as the leaf.arrow_forwardWhat is the shape of the distribution for both plots? This graph was from excel.arrow_forwardHistograms are considered good graphs AND they are used for Qualitative data. O True O Falsearrow_forward
arrow_back_ios
arrow_forward_ios
Recommended textbooks for you
 A First Course in Probability (10th Edition)ProbabilityISBN:9780134753119Author:Sheldon RossPublisher:PEARSON

A First Course in Probability (10th Edition)
Probability
ISBN:9780134753119
Author:Sheldon Ross
Publisher:PEARSON
