MATLAB: An Introduction with Applications
6th Edition
ISBN: 9781119256830
Author: Amos Gilat
Publisher: John Wiley & Sons Inc
expand_more
expand_more
format_list_bulleted
Question

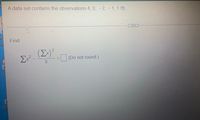
Transcribed Image Text:A data set contains the observations 4, 0, - 2, - 1, 1 .
Find
ir
(Ex)*
Σ
2.
(Do not round)
El
%3|
Expert Solution
This question has been solved!
Explore an expertly crafted, step-by-step solution for a thorough understanding of key concepts.
Step by stepSolved in 2 steps

Knowledge Booster
Similar questions
- A strong positive correlation means: the points in a scatter diagram lie on a downward sloping line O the points in a scatter diagram lie on an upward sloping line O ris close to -1 O ris close to 1arrow_forwardFollowing are the GPA's of the 30 students from a certain university who participated in a track meet. Draw a dot plot to better display the data. 3.2, 2.8, 2.0, 1.9, 3.0, 3.2, 2.9, 2.2, 2.1, 4.0, 3.5, 3.0, 3.1, 2.1, 3.5 O 4.0, 3.1, 3.3, 2.8, 3.9, 3.9, 3.7, 2.4, 2.9, 3.7, 2.7, 3.0, 2.7, 2.9, 3.9 Select the correct graph below. O A. OB. XX XX XXXXX X X XX x x XX XXXXXXX x x Xx XXXXXX XXX XXXXXX x x Xx XXXX X 15 25 35 1.5 25 35 OC. OD. XX XXX XXXXXXX x x XX XX XX X X X X Xx x x XXX X 15 25 3.5 1.5 25 3.5 Click to select your answer. Prt Scn, Home End DII F3 F5 * F2 F4 F1 & #3 %24arrow_forwardA researcher hypothesized that an increase in stress at work was caused by an increase in consumption of alcohol. Further research found that increased consumption of alcohol was caused by increased work stress. This is an example of O al a reverse cause-and-effect relationship a presumed cause-and-effect relationship an accidental cause-and-effect c) relationship d) a cause-and-effect relationship O b)arrow_forward
- The correlation between midterm and final grades for 300 students is 0.620. If 5 points are added to each midterm grade, the new r will be: a. 0.124 b. 0.57 c. 0.62 d. 0.744arrow_forwardWhich choice correctly describes the shape of this histogram? a.symmetric b.uniform c.skewed right d.skewed leftarrow_forwardthe data set shows the high school student grade . it have their mid and final test results. we wish to determine if there is a relationship between the two. 1 77 65 2 83 90 3 79 67 4 88 85 5 76 62 6 66 80 7 76 74 8 95 93 9 65 59 10 91 86 11 80 52 12 87 82 13 86 54 14 62 71 15 92 86 16 76 88 17 68 82 18 92 95 19 80 77 20 59 72 21 68 84 22 71 75 23 62 73 24 67 55 25 76 94 26 72 79 27 99 89 28 57 52 29 81 78 30 72 83 31 76 69 32 94 98 33 71 94 34 71 81 35 71 83 36 95 96 37 73 60 38 88 85 39 94 97 40 84 88 41 59 71 42 67 92 43 97 85 44 84 87 45 87 99 46 92 98 47 77 91 48 84 93 49 92 79 50 75 81 51 95 99 52 80 73 53 62 79 54 70 76 55 87 91 56 88 95 what is the equiation for the linear regression model? Final grade= ___ + ___ * Mid term grade (round to three decimal places) If cammy scores 73 on the midterm, her predicted final exam grade would be _______arrow_forward
- Find WI if IE = 3 E G EW and YG are medians of AXYWarrow_forwardFor each vignette, choose the type of research that is being conducted. There is only one correct answer for each vignette. Here are your answer choices for questions 1-18 Case Study Naturalistic Observation Laboratory Observation Survey Correlation Test Experiment Longitudinal Design Cross Section Cross Sequential Design Maria wants to understand the political demographics in her community, so she creates a questionnaire asking people to identify their age, gender, political affiliation, religion and marital status. After Maria collects the abovementioned data (in question #12), she then identifies the relationships between religion and political affiliation. Kathi…arrow_forwardMatch each scatterplot shown below with one of the four specified correlations Please helparrow_forward
arrow_back_ios
arrow_forward_ios
Recommended textbooks for you
 MATLAB: An Introduction with ApplicationsStatisticsISBN:9781119256830Author:Amos GilatPublisher:John Wiley & Sons Inc
 Probability and Statistics for Engineering and th...StatisticsISBN:9781305251809Author:Jay L. DevorePublisher:Cengage Learning
 Statistics for The Behavioral Sciences (MindTap C...StatisticsISBN:9781305504912Author:Frederick J Gravetter, Larry B. WallnauPublisher:Cengage Learning
 Elementary Statistics: Picturing the World (7th E...StatisticsISBN:9780134683416Author:Ron Larson, Betsy FarberPublisher:PEARSON
 The Basic Practice of StatisticsStatisticsISBN:9781319042578Author:David S. Moore, William I. Notz, Michael A. FlignerPublisher:W. H. Freeman
 Introduction to the Practice of StatisticsStatisticsISBN:9781319013387Author:David S. Moore, George P. McCabe, Bruce A. CraigPublisher:W. H. Freeman

MATLAB: An Introduction with Applications
Statistics
ISBN:9781119256830
Author:Amos Gilat
Publisher:John Wiley & Sons Inc

Probability and Statistics for Engineering and th...
Statistics
ISBN:9781305251809
Author:Jay L. Devore
Publisher:Cengage Learning

Statistics for The Behavioral Sciences (MindTap C...
Statistics
ISBN:9781305504912
Author:Frederick J Gravetter, Larry B. Wallnau
Publisher:Cengage Learning

Elementary Statistics: Picturing the World (7th E...
Statistics
ISBN:9780134683416
Author:Ron Larson, Betsy Farber
Publisher:PEARSON

The Basic Practice of Statistics
Statistics
ISBN:9781319042578
Author:David S. Moore, William I. Notz, Michael A. Fligner
Publisher:W. H. Freeman

Introduction to the Practice of Statistics
Statistics
ISBN:9781319013387
Author:David S. Moore, George P. McCabe, Bruce A. Craig
Publisher:W. H. Freeman