
MATLAB: An Introduction with Applications
6th Edition
ISBN: 9781119256830
Author: Amos Gilat
Publisher: John Wiley & Sons Inc
expand_more
expand_more
format_list_bulleted
Related questions
Concept explainers
Question
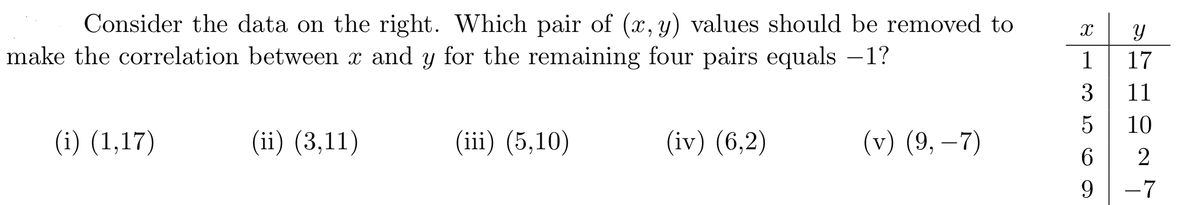

Transcribed Image Text:Consider the data on the right. Which pair of (x, y) values should be removed to
make the correlation between x and y for the remaining four pairs equals –1?
1
17
3
11
10
(i) (1,17)
(ii) (3,11)
(iii) (5,10)
(iv) (6,2)
(v) (9, –7)
9.
-7
Expert Solution
This question has been solved!
Explore an expertly crafted, step-by-step solution for a thorough understanding of key concepts.

This is a popular solution

Trending nowThis is a popular solution!

Step by stepSolved in 2 steps with 1 images

Knowledge Booster


Learn more about
Need a deep-dive on the concept behind this application? Look no further. Learn more about this topic, statistics and related others by exploring similar questions and additional content below.Similar questions
- The table shows the number of absences, x, in a class and the final exam grade, y, for seven students. X 1 0 2 6 4 3 3 Y 95 90 90 55 70 80 85 Use the graphing calculator to find the correlation coefficient. (Round answer to three decimal places. Do not write 0.123 as.123.)arrow_forwardLet x be the average number of employees in a group health insurance plan, and let y be the average administrative cost as a percentage of claims. x 3 7 15 32 75 y 40 35 30 26 18 (a) Make a scatter diagram of the data and visualize the line you think best fits the data. Flash Player version 10 or higher is required for this question. You can get Flash Player free from Adobe's website. (b) Would you say the correlation is low, moderate, or strong? positive or negative? strong and negative moderate and negative strong and positive low and negative low and positive moderate and positive (c) Use a calculator to verify that Σx = 132, Σx2 = 6932, Σy = 149, Σy2 = 4725, and Σxy = 2997. Compute r. (Round your answer to three decimal places.)r = As x increases, does the value of r imply that y should tend to increase or decrease? Explain. Given our value of r, we cannot draw any conclusions for the behavior of y as x increases. Given our value of r, y should tend to…arrow_forwardUse the data in the table, which shows the average annual salaries (both in thousands of dollars) for public school principals and teachers in the U.S. for 11 years. Apply what you have learned in the previous tab to complete this graded lab questions. 1. Repeat the steps from tab #1 using this data to construct a scatter plot graph and calculate the correlation coefficient R. (Recall the corelation coefficient is R and not R Teachers y Principalsx 77.8 43.7 78.4 43.8 80.8 45.0 R= 80.5 45.6, 2. Does the R value represent a positive, negative or no correlation between the salaries ol the teachers and principals? As teacher salaries increase, what happens to prinicipal salaries? 10 11 81.5 45.9 84.8 48.2 12 13 87.7 49,3 3. Write the equation of the regression line for the data below. The equation is y= 14 91.6 51.3 52.9 Teachers y 15 16 95.7 54.4 COD 54.2 =D0.5873x-2.0s07o R=0.995, 17 95.7 4. Use the regression equation that you found in exercise #3 to predict the average annual salary…arrow_forward
- Two statistically independent random have variances of Variables X and 0² and new ran- dom T variables Y 54 are + = 25. TWO defined by U = 3x + 4 Y V = 5X-2Yarrow_forwardHow does multiplying each score by a (positive) constant affect the value of the correlation? The correlation changes sign. The correlation does not change. The correlation decreases. The correlation increases.arrow_forwardPlot the scatter plot defined by the points on the left. Then match it to the correct correlation value. {(1, 3), (1, 8), (5, 9), (8, 3), (8, 8)} {(1, 4), (3, 3), (5, 7), (7, 5), (9, 8)} r = 0.03 r = -1arrow_forward
- Give an example of two variables that you would expect to have a correlation close to or equal to -1. Give an example of two variables that you would expect to have a correlation close to or equal to 0. Remember that survey question you wrote? Take the class responses to your survey as data related to the one variable of your question. Now, take the list of responses from the survey question that one of your classmates wrote. Write down both lists of data. (If one sample size happens to be different from the other, cut the larger sample size down to that of the smaller sample size.) Calculate the correlation between the two variables. Describe the linear relationship between these two variables. (data for number 3) How many cars have you had so far in your lifetime? 0,1,1,1,2,2,2,2,3,3,3,3,4,4,5,6,6,7,10. How many days per week do you exercise? 0,0,0,1,2,3,3,3,3,4,4,4,4,5,5,5,5,6,6,6arrow_forwardcalculate the correlation coefficient to three decimal places, x is 4,5,6,7,8,9, y, 6.05,8.64,3.93,4.92,2.31,4arrow_forwardThe strength of the correlation is indicated by a number value and the closer that value is to zero, the weaker the correlation. O True O Falsearrow_forward
arrow_back_ios
arrow_forward_ios
Recommended textbooks for you
- MATLAB: An Introduction with ApplicationsStatisticsISBN:9781119256830Author:Amos GilatPublisher:John Wiley & Sons Inc
 Probability and Statistics for Engineering and th...StatisticsISBN:9781305251809Author:Jay L. DevorePublisher:Cengage Learning
 Statistics for The Behavioral Sciences (MindTap C...StatisticsISBN:9781305504912Author:Frederick J Gravetter, Larry B. WallnauPublisher:Cengage Learning
  Elementary Statistics: Picturing the World (7th E...StatisticsISBN:9780134683416Author:Ron Larson, Betsy FarberPublisher:PEARSON
 The Basic Practice of StatisticsStatisticsISBN:9781319042578Author:David S. Moore, William I. Notz, Michael A. FlignerPublisher:W. H. Freeman
 Introduction to the Practice of StatisticsStatisticsISBN:9781319013387Author:David S. Moore, George P. McCabe, Bruce A. CraigPublisher:W. H. Freeman
MATLAB: An Introduction with Applications
Statistics
ISBN:9781119256830
Author:Amos Gilat
Publisher:John Wiley & Sons Inc
Probability and Statistics for Engineering and th...
Statistics
ISBN:9781305251809
Author:Jay L. Devore
Publisher:Cengage Learning
Statistics for The Behavioral Sciences (MindTap C...
Statistics
ISBN:9781305504912
Author:Frederick J Gravetter, Larry B. Wallnau
Publisher:Cengage Learning
Elementary Statistics: Picturing the World (7th E...
Statistics
ISBN:9780134683416
Author:Ron Larson, Betsy Farber
Publisher:PEARSON
The Basic Practice of Statistics
Statistics
ISBN:9781319042578
Author:David S. Moore, William I. Notz, Michael A. Fligner
Publisher:W. H. Freeman
Introduction to the Practice of Statistics
Statistics
ISBN:9781319013387
Author:David S. Moore, George P. McCabe, Bruce A. Craig
Publisher:W. H. Freeman