
FINANCIAL ACCOUNTING
10th Edition
ISBN: 9781259964947
Author: Libby
Publisher: MCG
expand_more
expand_more
format_list_bulleted
Related questions
Question
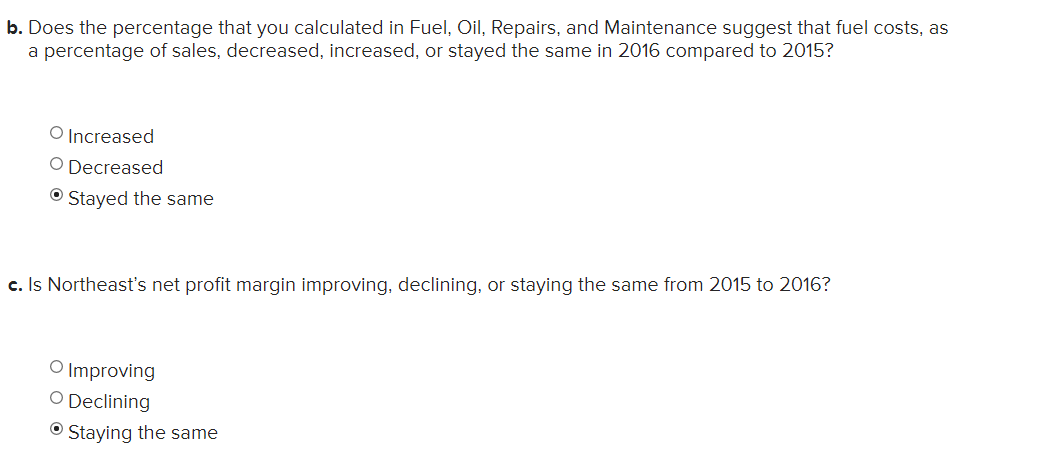

Transcribed Image Text:b. Does the percentage that you calculated in Fuel, Oil, Repairs, and Maintenance suggest that fuel costs, as
a percentage of sales, decreased, increased, or stayed the same in 2016 compared to 2015?
O Increased
O Decreased
O Stayed the same
c. Is Northeast's net profit margin improving, declining, or staying the same from 2015 to 2016?
O Improving
O Declining
O Staying the same

Transcribed Image Text:A condensed income statement for Northeast Airlines and a partially completed vertical analysis are
presented below.
ts
Required:
1. Complete the vertical analysis by computing each missing line item as a percentage of sales revenues.
(Round your answers to the nearest whole percent.)
еВook
Print
NORTHEAST AIRLINES
Income Statement (summarized)
For the Year Ended December 31
eferences
(in millions of U.S. dollars)
2016
2015
Sales Revenues
$ 20,925
100
$ 20,320
100 %
Salaries and Wages Expense
6,823
33
6,408
Fuel, Oil, Repairs, and Maintenance
4,717
4,646
Other Operating Expenses
5,200
4,725
23
Other Expenses (Revenues)
238
1
652
Income before Income Tax Expense
3,947
19
3,889
19
Income Tax Expense
Net Income
1,370
7
1,361
7
$ 2,577
% $ 2,528
%
中
Expert Solution
This question has been solved!
Explore an expertly crafted, step-by-step solution for a thorough understanding of key concepts.

This is a popular solution

Trending nowThis is a popular solution!

Step by stepSolved in 2 steps with 2 images

Knowledge Booster


Learn more about
Need a deep-dive on the concept behind this application? Look no further. Learn more about this topic, accounting and related others by exploring similar questions and additional content below.Similar questions
- Computing and Interpreting Financial Statement Ratios Following are selected ratios of Norfolk Southern for 2018 and 2017. Return on Assets (ROA) Component 2018 2017 Profitability (Net income/Sales) 25.3% 53.2% Productivity (Sales/Average assets) 0.338 0.319 a. Was the company profitable in 2018?Answer b. Was the company more profitable in 2018 or 2017?Answer c. Is the change in productivity a positive or negative development?Answer d. Compute the company’s ROA for 2018 and for 2017. Note: Round answers to one decimal places (example: 10.4%). ROA 2018 Answer 2017 Answer e. From the information provided, which of the following best explains the change in ROA during 2018? Answerarrow_forwardCurrent Attempt in Progress Operating data for Grouper Corp. are presented as follows. Net sales Cost of goods sold Selling expenses Administrative expenses Income tax expense Net income 2022 $840,000 540,120 133,560 57,120 31,920 77,280 2021 $610,000 405,650 80,520 46,970 26,840 50,020 Prepare a schedule showing a vertical analysis for 2022 and 2021. (Round percentages to 1 decimal place, e.g. 12.1%.)arrow_forwardCompare Income Statements and Balance Sheets of Competitorsa. Following are selected income statement data for two communications companies, Comcast and Verizon, for the year ended December 31, 2018. Express each income statement amount as a percentage of sales.Note: Round percentage to one decimal point (for example, round 18.566% to 18.6%). Income Statement ($ millions) Comcast Verizon Sales $87,892 Answer $121,703 Answer Operating costs 75,498 Answer 108,585 Answer Operating profit 12,394 Answer 13,118 Answer Nonoperating expenses 6,647 Answer 5,802 Answer Net income $5,747 Answer $7,316 Answer b. Following are selected balance sheet data for two communications companies, Comcast and Verizon, for the year ended December 31, 2018. Express each balance sheet amount as a percentage of total assets.Note: Round percentage to one decimal point (for example, round 18.566% to 18.6%). Balance Sheet ($ millions) Comcast Verizon Current assets $20,319 Answer $32,211…arrow_forward
- Splish Brothers Inc. has the following income statement (in millions): SPLISH BROTHERS INC.Income StatementFor the Year Ended December 31, 2023 Net Sales $250 Cost of Goods Sold 175 Gross Profit 75 Operating Expenses 50 Net Income $ 25 Using vertical analysis, what percentage is assigned to net income?arrow_forwardThe following information was available for the year ended December 31, 2016: Sales $ 460,000 Net income 66,140 Average total assets 760,000 Average total stockholders' equity 365,000 Dividends per share 1.33 Earnings per share 3.00 Market price per share at year-end 27.60 a. Calculate margin, turnover, and ROI for the year ended December 31, 2016. (Round your intermediate calculations and final answers to 2 decimal places.) b. Calculate ROE for the year ended December 31, 2016. (Round your answer to 2 decimal places.) c. Calculate the price/earnings ratio for 2016. (Round your answer to 2 decimal places.) d. Calculate the dividend payout ratio for 2016. (Round your answer to 2 decimal places.) e. Calculate the dividend yield for 2016. (Round your answer to 2 decimal places.)arrow_forwardProblem: The financial statements of Muscat Company appear below: MUSCAT COMPANY Income Statement For the Year Ended December 31, 2023 Net sales Cost of goods sold Gross profit \table[[$400,000dearrow_forward
- The following information is from General Electric Corporation's annual reports. General Electric Year 2015 Revenue ($ Billion) Employees (thousands) 2016 $ 94.79 103.60 334 296 2017 2018 2019 2020 99.78 97.51 95.51 79.92 314 284 206 175 Click here for the Excel Data File Compute a simple index for the revenue of GE using the period 2015 to 2016 as the base. Note: Round your answers to 2 decimal places. The index (2015 to 2016=100) for selected years is: Year Simple Index 2015 2016 2017 2018 2019 2020 What can you conclude about the change in revenue over the period? Note: Round your answer to 2 decimal places. Compared to the average of 2015 and 2016, revenue is % lower.arrow_forwardThe Cullumber Supply Company reported the following information for 2017. Prepare a common-size income statement for the year ended June 30, 2017. (Round answers to 1 decimal place, e.g. 52.7%.) Cullumber Supply CompanyIncome Statement for the Fiscal Year Ended June 30, 2017($ thousands) % of Net Sales Net sales $2,111,000 enter percentages of net sales % Cost of goods sold 1,464,000 enter percentages of net sales % Selling and administrative expenses 312,200 enter percentages of net sales % Nonrecurring expenses 27,600 enter percentages of net sales % Earnings before interest, taxes, depreciation, and amortization (EBITDA) $307,200 enter percentages of net sales % Depreciation 117,000 enter percentages of net sales % Earnings before interest and taxes (EBIT) 190,200 enter percentages of net sales % Interest expense 118,600 enter percentages of net sales % Earnings before taxes (EBT)…arrow_forwardPlease helparrow_forward
- Forecast Income Statement and Balance Sheet Following are the income statement and balance sheet for Medtronic PLC. Note: Complete the entire question using the following Excel template: Excel Template. Then enter the answers into the provided spaces below with two decimal places. Medtronic PLC Consolidated Statement of Income $ millions, For Fiscal Year Ended April 26, 2019 Net sales $30,557 Costs and expenses Cost of products sold 9,155 Research and development expense 979 Selling, general, and administrative expense 10,418 Amortization of intangible assets 1,764 Restructuring charges, net 83 Certain litigation charges, net 166 Other operating expense, net 258 Operating profit 7,734 Other nonoperating income, net (157) Interest expense 1,444 Income before income taxes 6,447 Income tax provision 547 Net income 5,900 Net income loss attributable to noncontrolling interests (19) Net income attributable to Medtronic $5,881…arrow_forward1arrow_forwardBramble Corp. reported the following in its 2025 and 2024 income statements. Net sales Cost of goods sold Operating expenses Income tax expense Net income Gross profit rate 2025 $154,000 86,240 27,720 21,560 $18,480 (a1) Determine the company's gross profit rate and profit margin for both years. (Round answers to 1 decimal place, eg. 52.7%) Profit margin 2024 $124,000 69,440 16,120 13,640 $24,800 2025 2024 %arrow_forward
arrow_back_ios
arrow_forward_ios
Recommended textbooks for you
 AccountingAccountingISBN:9781337272094Author:WARREN, Carl S., Reeve, James M., Duchac, Jonathan E.Publisher:Cengage Learning,
 Accounting Information SystemsAccountingISBN:9781337619202Author:Hall, James A.Publisher:Cengage Learning,
 Horngren's Cost Accounting: A Managerial Emphasis...AccountingISBN:9780134475585Author:Srikant M. Datar, Madhav V. RajanPublisher:PEARSON
 Intermediate AccountingAccountingISBN:9781259722660Author:J. David Spiceland, Mark W. Nelson, Wayne M ThomasPublisher:McGraw-Hill Education
 Financial and Managerial AccountingAccountingISBN:9781259726705Author:John J Wild, Ken W. Shaw, Barbara Chiappetta Fundamental Accounting PrinciplesPublisher:McGraw-Hill Education
Accounting
Accounting
ISBN:9781337272094
Author:WARREN, Carl S., Reeve, James M., Duchac, Jonathan E.
Publisher:Cengage Learning,
Accounting Information Systems
Accounting
ISBN:9781337619202
Author:Hall, James A.
Publisher:Cengage Learning,
Horngren's Cost Accounting: A Managerial Emphasis...
Accounting
ISBN:9780134475585
Author:Srikant M. Datar, Madhav V. Rajan
Publisher:PEARSON
Intermediate Accounting
Accounting
ISBN:9781259722660
Author:J. David Spiceland, Mark W. Nelson, Wayne M Thomas
Publisher:McGraw-Hill Education
Financial and Managerial Accounting
Accounting
ISBN:9781259726705
Author:John J Wild, Ken W. Shaw, Barbara Chiappetta Fundamental Accounting Principles
Publisher:McGraw-Hill Education