Algebra and Trigonometry (6th Edition)
6th Edition
ISBN: 9780134463216
Author: Robert F. Blitzer
Publisher: PEARSON
expand_more
expand_more
format_list_bulleted
Question

Transcribed Image Text:Orinking
uiz: MUST DO: -W 6 Dot P
tructure.com/courses/1180629/auizzes/7348921/take
nard
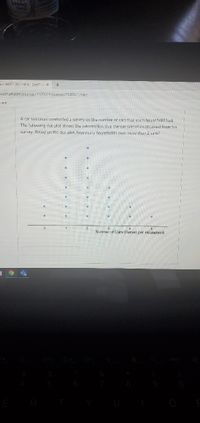
A car salesman conducted a survey on the number of cars that each household had.
The following dot plot shows the information that the car salesman obtained from his
survey. Rased on the dot plot, how many households own more than 2 cars?
Number of Cars Owned per Household
Expert Solution
This question has been solved!
Explore an expertly crafted, step-by-step solution for a thorough understanding of key concepts.
This is a popular solution
Trending nowThis is a popular solution!
Step by stepSolved in 2 steps

Knowledge Booster
Learn more about
Need a deep-dive on the concept behind this application? Look no further. Learn more about this topic, algebra and related others by exploring similar questions and additional content below.Similar questions
- A statistics professor kept attendance records and recorded the number of absent students per class. This data is displayed in the following histogram with the frequency of each number of absent students shown above the bars. How many total classes do these data represent?arrow_forwardThe final letter grades earned on a mathematies course are given in the table below. A B C D F W 12 20 10 4 Use a pie chart to represent this data. Write down the work leading to your answer. The last page has a protractor which you may print and use.arrow_forwardThe prices vary depending on the condition of the radio. $210, $210, $320, $200, $300, $10, $340, $300, $245, $325, $700, $250, $240, $200 a. Find the mean of the radio prices. Round to the nearest cent.arrow_forward
- ↑ A survey was conducted by a website on which online music channels subscribers use on a regular basis. The following information summarizes the answers. 11 listened to rap, heavy metal, and alternative rock. 18 listened to rap and heavy metal. 20 listened to heavy metal and alternative rock. 16 listened to rap and alternative rock. 25 listened to rap. 40 listened to heavy metal. 31 listened to alternative rock. 20 listened to none of these three channels. a. How many people were surveyed? b. How many people listened to either rap or alternative rock? c. How many listened to heavy metal only? a. How many people were surveyed?arrow_forwardUse the box-and-whisker plot to identify the five-number summary. 940 2081 1205 1477 1957 900 1200 1500 1800 2100arrow_forwardFind the midrange for the following group of data items. 112, 52, 82, 52, 72 (Round to the nearest tenth as needed.)arrow_forward
- The value of a certain car when it was brand new with 0 mileage was $17,000 but the value dropped to $4,000 when the car acounulated 80,000 miles shown in the scatter plot below. Car's Mleage and Value S17.000 $2,000 Mileage Based on the data in the scatter plot, at what mileage was the car worth about $12,000? O 20,000 miles O 30,000 miles O 60,000 miles O 80,000 milesarrow_forwardThe Acme Company manufactures widgets. The distribution of widget weights is bell-shaped. The widget weights have a mean of 40 ounces and a standard deviation of 10 ounces. Use the Standard Deviation Rule, also known as the Empirical Rule. Suggestion: sketch the distribution in order to answer these questions. a) 99.7% of the widget weights lie between and b) What percentage of the widget weights lie between 20 and 70 ounces? c) What percentage of the widget weights lie above 30 ? Question Help: Video Message instructor %arrow_forwardA pediatrician wants to determine the relation that may exist between a child's height and head circumference. She randomly selects 5 children and measures their height and head circumference. The data are summarized below. Complete parts (a) through (f) below. Height (inches), x Head Circumference (inches), y 27.75 27.5 25.5 26 270 17.6 17.5 17.1 17.3 17.5 (a) Treating height as the explanatory variable, x, use technology to determine the estimates of B and B4 Po z bo = (Round to four decimal places as needed.) B, xb, = (Round to four decimal places as needed.)arrow_forward
- Find the median?arrow_forwardFind the original data from the stem-and-leaf plot. Stem leaves 76 358 77 348 78 18arrow_forwardUse a stem-and-leaf plot to display the data, which represent the numbers of hours 24 nurses work per week. Describe any patterns. 33 40 36 53 32 36 40 35 40 40 41 48 30 26 40 36 40 36 40 33 40 32 38 29 Determine the leaves in the stem-and-leaf plot below. Key: 313 33 Hours worked 3 4arrow_forward
arrow_back_ios
SEE MORE QUESTIONS
arrow_forward_ios
Recommended textbooks for you
 Algebra and Trigonometry (6th Edition)AlgebraISBN:9780134463216Author:Robert F. BlitzerPublisher:PEARSON
 Contemporary Abstract AlgebraAlgebraISBN:9781305657960Author:Joseph GallianPublisher:Cengage Learning
 Linear Algebra: A Modern IntroductionAlgebraISBN:9781285463247Author:David PoolePublisher:Cengage Learning
 Algebra And Trigonometry (11th Edition)AlgebraISBN:9780135163078Author:Michael SullivanPublisher:PEARSON
 Introduction to Linear Algebra, Fifth EditionAlgebraISBN:9780980232776Author:Gilbert StrangPublisher:Wellesley-Cambridge Press
 College Algebra (Collegiate Math)AlgebraISBN:9780077836344Author:Julie Miller, Donna GerkenPublisher:McGraw-Hill Education

Algebra and Trigonometry (6th Edition)
Algebra
ISBN:9780134463216
Author:Robert F. Blitzer
Publisher:PEARSON

Contemporary Abstract Algebra
Algebra
ISBN:9781305657960
Author:Joseph Gallian
Publisher:Cengage Learning

Linear Algebra: A Modern Introduction
Algebra
ISBN:9781285463247
Author:David Poole
Publisher:Cengage Learning

Algebra And Trigonometry (11th Edition)
Algebra
ISBN:9780135163078
Author:Michael Sullivan
Publisher:PEARSON

Introduction to Linear Algebra, Fifth Edition
Algebra
ISBN:9780980232776
Author:Gilbert Strang
Publisher:Wellesley-Cambridge Press

College Algebra (Collegiate Math)
Algebra
ISBN:9780077836344
Author:Julie Miller, Donna Gerken
Publisher:McGraw-Hill Education