
MATLAB: An Introduction with Applications
6th Edition
ISBN: 9781119256830
Author: Amos Gilat
Publisher: John Wiley & Sons Inc
expand_more
expand_more
format_list_bulleted
Related questions
Question

Transcribed Image Text:### Utilizing a Stem-and-Leaf Plot for Data Representation
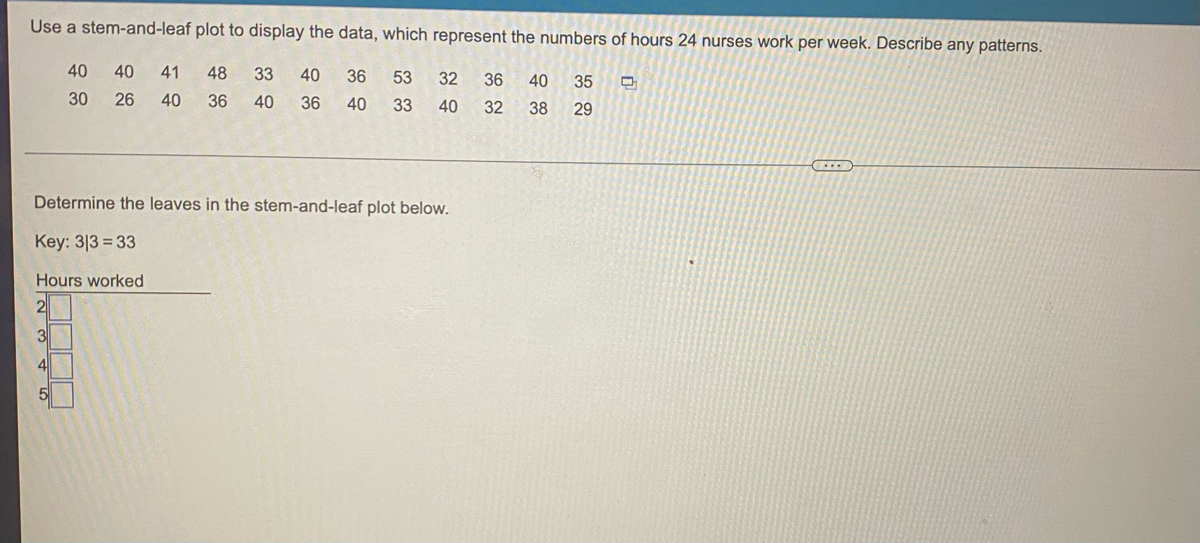
Stem-and-leaf plots are a method for organizing numerical data in order to visualize its distribution. In this example, we display the numbers of hours that 24 nurses work per week. The task at hand is to observe and describe any patterns within the data.
**Data Set:**
```
40, 40, 41, 48, 33, 40, 36, 53, 32, 36,
30, 26, 40, 36, 40, 36, 40, 35, 33, 40,
32, 38, 29
```
**Instructions:**
The stem represents the leading digit(s), while the leaf represents the last digit of each number. For example, if the number is 33, the stem is 3 and the leaf is 3.
### Detailed Stem-and-Leaf Plot:
**Key:** 3 | 3 = 33
| Hours Worked (Stem) | Leaves |
|---------------------|------------------------------------|
| 2 | 6, 9 |
| 3 | 0, 0, 2, 2, 3, 3, 5, 6, 6, 6, 8 |
| 4 | 0, 0, 0, 0, 0, 0, 0, 1, 6, 8 |
| 5 | 3 |
### Analysis:
- The highest frequency of hours worked appears in the range of the 30s, with 11 occurrences.
- The 40-hour work week is also highly common, represented by 8 occurrences within the 40s range.
- There are only 2 occurrences within the 20s and 1 in the 50s.
The stem-and-leaf plot effectively shows that the majority of the nurses work between 30 to 40 hours a week, with 40 and 36 hours being the most common individual numbers. This visualization helps in easily understanding the distribution and identifying patterns in the work hours of nurses.
Expert Solution
This question has been solved!
Explore an expertly crafted, step-by-step solution for a thorough understanding of key concepts.

This is a popular solution

Trending nowThis is a popular solution!

Step by stepSolved in 2 steps with 1 images

Knowledge Booster

Similar questions
- Use a stem-and-leaf plot that has two rows for each stem to display the data, which represert the income (in millions) of 30 of the highest paid athletes. Describe any patterns. 38 3644 503558 56 66476346 37了7 45 34.D 44 43 81 53 38 73 34 38 87 34 53 41 42 45 88 Determine the leaves in the stem-and-leaf plot below. Key. 33=33 Income (5 millions)arrow_forwardGive the 5-number summary and construct a box plot for the following 40 data values. Also, find P56- 25 35 43 44 47 48 54 55 56 57 59 62 63 65 66 68 69 69 71 72 72 73 74 76 77 77 78 79 80 81 81 82 83 85 89 92 93 94 97 98arrow_forwardThe following data gives the number of hours 5 students spent studying and their corresponding grades on their midterm exams. Hours Spent Studying 1 3 4 5 6. Midterm Grades 69 81 87 90 96 Copy Data Draw a scatter plot of the given data. 国 Tables E Keypad Answer Keyboard Shortcuts Select a location in the chart to plot a point. Points can be moved by dragging or using the arrow keys. Select the Clear button to remove all points. 99 - 96 - 93 - 90 - 87 - 84 - 81 - 78 Clear 75 - 72 - 69 - 66 - 63 - 60 + 6 Hours Spent Studying Midterm Gradesarrow_forward
- A small organic chemistry class just took their midterm. The scores of the eight students are listed below. 65, 73, 78, 85, 87, 69, 90, 32 What type of graph could you use to represent this data? A. histogram B. bar chart C. pie chart D. stem and leaf E. All of the above O F. A and D only G. B and C only Click to select your answer. O Oarrow_forwardThe data represents the heights of eruptions by a geyser. Use the heights to construct a stemplot. Identify the two values that are closest to the middle when the data are sorted in order from lowest to highest. Which plot represents a stemplot of the data? A. 3 037 4 068 5 001 6006 7 006 8057 9 09 B. 3 4 4 016668 50057 6 009 7 00 37 80 9 0 Identify the two values that are closest to the middle when the data are sorted in order from lowest to highest. The values closest to the middle are inches and inches. (Type whole numbers. Use ascending order.) C. 3 4 4 03 5 00067 6 01668 7 0057 8 09 910 Height of eruption (in.) 68 34 50 90 80 50 40 70 50 61 75 66 66 43 56 60 77 70 89 88557arrow_forwardThe data represents the heights of eruptions by a geyser. Use the heights to construct a stemplot. Identify the two values that are closest to the middle when the data are sorted in order from lowest to highest. Height of eruption (in.) 69 33 50 900 80 50 40 70 50 68 79 54 Which plot represents a stemplot of the data? OA. 3 002 4049 5008 6005 7006 8009 906 B. 33 400 500024 605689 70009 806 90 Identify the two values that are closest to the middle when the data are sorted in order from lowest to highest. The values closest to the middle are inches and (Type whole numbers. Use ascending order.) inches. O C. 33 4045689 50009 6006 70002 80 90 52 66 65 60 70 70 40 86arrow_forward
- Use the box-and-whisker plot to identify the five-number summary. 940 2081 1205 1477 1957 900 1200 1500 1800 2100arrow_forwardKindly answer 1-2arrow_forwardA researcher is interested in exploring the relationship between lengths and weights of low birth weight infants. Using the table in the image attached, create a scatter plot graph, using R, in Jupyterhub. Describe what you see, include the code, and graph.arrow_forward
- The data represents the heights of eruptions by a geyser. Height of eruption (in.) 900 69 34 50 Use the heights to construct a stemplot. Identify the two values that are closest to the middle when the data are sorted in order from lowest to highest. 80 50 40 70 50 60 72 52 52 65 69 60 79 70 46 81 Which plot represents a stemplot of the data? A. В. C. 3 4 3 4 3 0 26 4 0 29 4 00 2 5 99 5 00 29 6 00 1 7 002 6 4 |0 6 5 000 22 6 |00 5 99 70029 5 000 6 |0 09 700 5 8 0 8 0 1 8 0 29 9 10 9 |0 1 Identify the two values that are closest to the middle when the data are sorted in order from lowest to highest. The values closest to the middle are inches and inches. (Type whole numbers. Use ascending order.) B.arrow_forwardA ✩ The box-and-whisker plot below represents the length, in inches, of 20 trout caught at Raystown Lake in one weekend. 4466619/varlants/5145485/take/5/ 10 Length of Trout (inches) H 15 20 H 25 30 How many trout were less than 20 inches long? Hint: 20 inches is the upper quartile of the box-and- whisker plot. So, 75% of the trout were less than 20 inches long. To find the answer: multiply the percentage (75%) x 20 (the number of inches) We use 75% because that is the Q3 in the data. 25% would be our Q1 and 50% is the median (or Q2).arrow_forwardUse a stem-and-leaf plot to display the data, which represent the thickness (in centimeters) of ice measured at 20 different locations on a frozen lake. Describe any patterns. 5.8 6.3 6.9 7.2 5.1 4.9 4.6 5.8 7.0 6.8 8.2 7.5 7.2 5.8 7.2 8.0 7.4 6.9 5.9 4.9 Determine the leaves in the stem-and-leaf plot below. Key: 3|3 = 3.3 Ice Thickness 6| 8 What best describes the data? A. Most thicknesses are greater than 7 centimeters. B. Most thicknesses are 6 centimeters. C. Most thicknesses are between 5 and 8 centimeters. D. Most thicknesses are less than 5 centimeters.arrow_forward
arrow_back_ios
SEE MORE QUESTIONS
arrow_forward_ios
Recommended textbooks for you
- MATLAB: An Introduction with ApplicationsStatisticsISBN:9781119256830Author:Amos GilatPublisher:John Wiley & Sons Inc
 Probability and Statistics for Engineering and th...StatisticsISBN:9781305251809Author:Jay L. DevorePublisher:Cengage Learning
 Statistics for The Behavioral Sciences (MindTap C...StatisticsISBN:9781305504912Author:Frederick J Gravetter, Larry B. WallnauPublisher:Cengage Learning
  Elementary Statistics: Picturing the World (7th E...StatisticsISBN:9780134683416Author:Ron Larson, Betsy FarberPublisher:PEARSON
 The Basic Practice of StatisticsStatisticsISBN:9781319042578Author:David S. Moore, William I. Notz, Michael A. FlignerPublisher:W. H. Freeman
 Introduction to the Practice of StatisticsStatisticsISBN:9781319013387Author:David S. Moore, George P. McCabe, Bruce A. CraigPublisher:W. H. Freeman
MATLAB: An Introduction with Applications
Statistics
ISBN:9781119256830
Author:Amos Gilat
Publisher:John Wiley & Sons Inc
Probability and Statistics for Engineering and th...
Statistics
ISBN:9781305251809
Author:Jay L. Devore
Publisher:Cengage Learning
Statistics for The Behavioral Sciences (MindTap C...
Statistics
ISBN:9781305504912
Author:Frederick J Gravetter, Larry B. Wallnau
Publisher:Cengage Learning
Elementary Statistics: Picturing the World (7th E...
Statistics
ISBN:9780134683416
Author:Ron Larson, Betsy Farber
Publisher:PEARSON
The Basic Practice of Statistics
Statistics
ISBN:9781319042578
Author:David S. Moore, William I. Notz, Michael A. Fligner
Publisher:W. H. Freeman
Introduction to the Practice of Statistics
Statistics
ISBN:9781319013387
Author:David S. Moore, George P. McCabe, Bruce A. Craig
Publisher:W. H. Freeman