
Related questions
Question 2: When John started his first job, his first end-of-year salary was $82,500. In the following years, he received salary raises as shown in the following table.
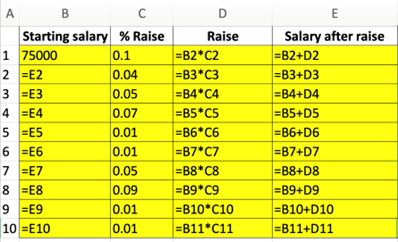
- Fill the Table: Fill the following table showing his end-of-year salary for each year. I have already provided the end-of-year salaries for the first three years. Calculate the end-of-year salaries for the remaining years using Excel. (If you Excel answer for the top 3 cells is not the same as the one in the following table, your formula / approach is incorrect) (2 points)
- Geometric
Mean of Salary Raises: Calculate the geometric mean of the salary raises using the percentage figures provided in the second column named “% Raise”. (The geometric mean for this calculation should be nearly identical to the arithmetic mean. If your answer deviates significantly from the mean, it's likely incorrect. 2 points)
Hint for the first part of question 2: To assist you with filling out the table in the first part of the question, I have provided the relevant syntax. The following are intended as hints only. For more details, please refer to the PowerPoint slides and the lecture video
Hint for the second part of question 2: To assist you with the second part of the question, which involves calculating the geometric mean, I use the following formulas. More details are provided in the PowerPoint slides and the video.
Geometric mean = GEOMEAN(Select all the values in % raise column + 1) -1
|
Starting salary |
% Raise |
Raise |
Salary after raise |
|
75000 |
10% |
7500 |
82500 |
|
82500 |
4% |
3300 |
85800 |
|
85800 |
5% |
4290 |
90090 |
|
|
7% |
|
|
|
|
1% |
|
|
|
|
1% |
|
|
|
|
5% |
|
|
|
|
9% |
|
|
|
|
1% |
|
|
|
|
1% |
|
|


Step by stepSolved in 2 steps with 2 images


- PART B (3.21x1043.21×104 )(0.2506) Express your answer in appropriate significant figures. 0.0579/0.683 Express your answer in appropriate significant figures.arrow_forwardPlz complet answerarrow_forwardCalculate to the correct number of significant figures. [(28.7x10⁵)/48.533] + 144.99arrow_forward
- Algebra: Structure And Method, Book 1AlgebraISBN:9780395977224Author:Richard G. Brown, Mary P. Dolciani, Robert H. Sorgenfrey, William L. ColePublisher:McDougal Littell
 College Algebra (MindTap Course List)AlgebraISBN:9781305652231Author:R. David Gustafson, Jeff HughesPublisher:Cengage Learning