
MATLAB: An Introduction with Applications
6th Edition
ISBN: 9781119256830
Author: Amos Gilat
Publisher: John Wiley & Sons Inc
expand_more
expand_more
format_list_bulleted
Related questions
Question

Transcribed Image Text:**Research Scenario and Statistical Analysis**
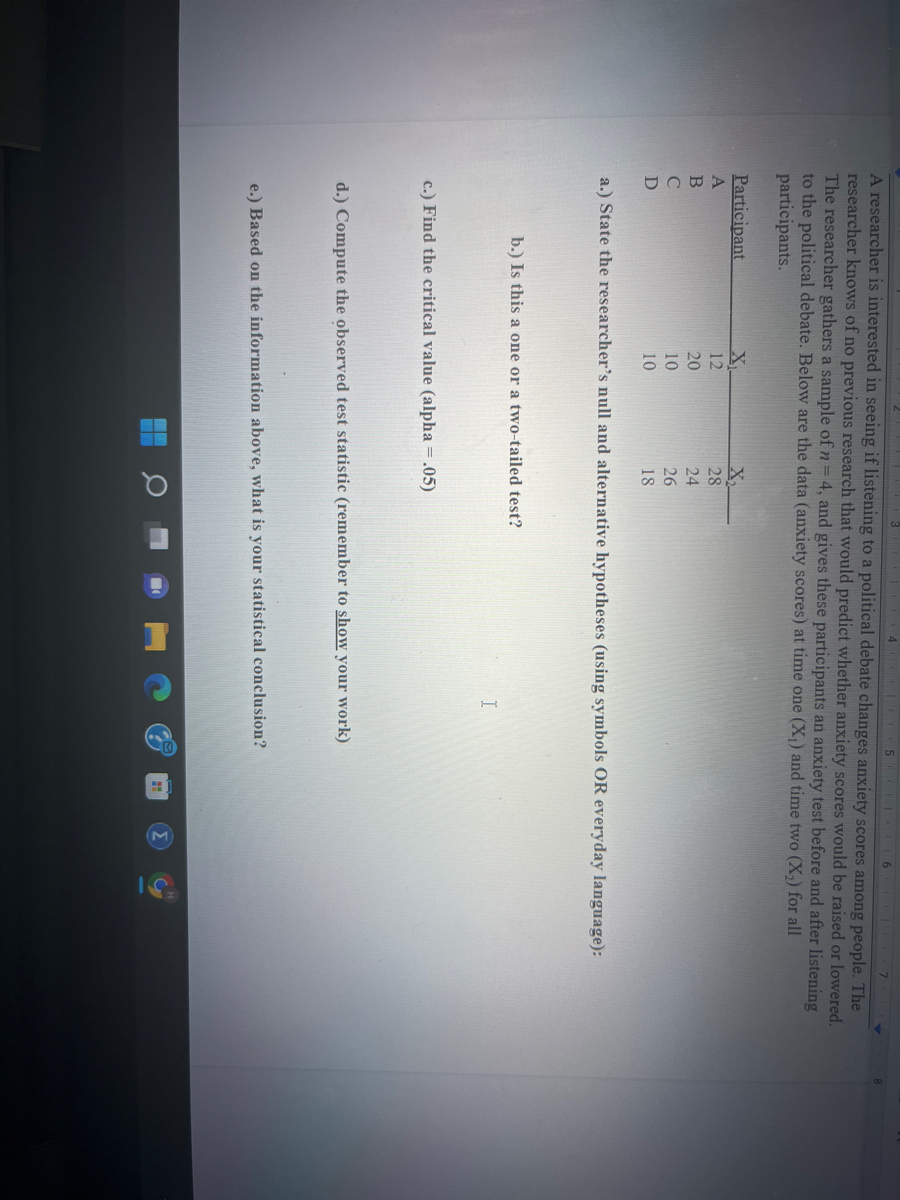
A researcher is interested in seeing if listening to a political debate changes anxiety scores among people. The researcher knows from previous research that women generally score higher levels of anxiety.
The hypothesis predicted whether anxiety scores would be raised or lowered. Participants were given an anxiety test before and after listening to the political debate. Below are the data for four participants:
| Participant | Time 1 (X₁) | Time 2 (X₂) |
|-------------|------------|-------------|
| A | 20 | 24 |
| B | 22 | 26 |
| C | 10 | 12 |
| D | 18 | 20 |
**Questions:**
a) State the researcher's null and alternative hypotheses (using symbols OR everyday language).
b) Is this a one or a two-tailed test?
c) Find the critical value (alpha = .05).
d) Compute the observed test statistic (remember to show your work).
e) Based on the information above, what is your statistical conclusion?
Expert Solution
arrow_forward
Step 1
It is given that the researcher gathers a sample of size n = 4 and gives these participants an anxiety test before and after listening to the political debate.
Note: According to Bartleby expert guidelines, we can answer only first question with their three subparts and rest can be reposted.

Step by stepSolved in 3 steps

Knowledge Booster

Similar questions
- 5Help me answer the questionarrow_forwardState whether the standardized test statistict indicates that you should reject the null hypothesis. Explain. (a) t=2.242 (b) t= 0 (c) t=2.195 (d) t= -2.254 0. (a) For t 2.242, should you reject or fail to reject the null hypothesis? O A. Reject Ho, because t> 2.219. O B. Reject Ho, because t 2.219. O D. Fail to reject Ho, because t<2.219.arrow_forwardScore: 0 of 1 pt 9 of 28 (13 complete) Instructor-created question Course Note Packet Chapter 9 Page 7,9 and 10 If, in a sample of n = 25 selected from a normal population, X= 53 and S= 5, what is the value of tSTAT if you are testing the null hypothesis Ho: H= 50? tSTAT =O (Type an integer or a decimal.)arrow_forward
- paired T test for the following: My project question is: Did the mental health decline after COVID? Score 1 is the avg mental health score pre-covid, score 2 is the avg mental health score post- covid. Show your work.arrow_forward1arrow_forwardThe average wait time to get seated at a popular restaurant in the city on a Friday night is 13 minutes. Is the mean wait time less for men who wear a tie? Wait times for 16 randomly selected men who were wearing a tie are shown below. Assume that the distribution of the population is normal. 11, 14, 14, 14, 13, 13, 10, 11, 10, 10, 12, 10, 12, 14, 13, 11 What can be concluded at the the a = 0.05 level of significance level of significance?arrow_forward
- Based on the Cl for the difference you see in this figure, you know that in the NHST approach: Interview Interest 14 12 10 6 2 B Male My Female M www A 2 0 Difference -2 -4 O This is a statistically significant result, p 0.05, fail to reject the null. O Both of the above. O No conclusions can be drawn about the NHST approach-this approach do not apply to paired designs.arrow_forwardI just need help with C-E If its helpful for A) I got 21 degrees of freedom and B) I got [-1.721, 1.721]arrow_forwardConsider the data. xi 3 12 6 20 14 yi 60 40 65 5 15 Use the t test to test the following hypotheses (? = 0.05): H0: ?1 = 0 Ha: ?1 ≠ 0 Find the value of the test statistic. (Round your answer to three decimal places.) Use the F test to test the hypotheses in part (d) at a 0.05 level of significance. Present the results in the analysis of variance table format.arrow_forward
- Before the furniture store began its ad campaign, it averaged 222 customers per day. The manager is investigating if the average is smaller since the ad came out. The data for the 14 randomly selected days since the ad campaign began is shown below. Round your mean and standard deviation to three decimal places when doing these calculations. 224, 211, 206, 206, 232, 189, 222, 197, 220, 210, 212, 213, 208, 189 Download CSV Assuming that the distribution is normal, what can be concluded at the a = 0.01 level of significance?arrow_forwardJ sampled 1000 people, and determined whether they are a teacher or not and their gender. J found the information in the following table. Is an Teacher Isn't an Teacher Male 42 449 Female 5 488 Other 1 15 Perform a chi-squared test of independence to test the null hypothesis that gender and status as an teacher are independent versus the alternative that they are dependent. What is the p-value for this test? What are the steps to come to this conclusion?arrow_forward
arrow_back_ios
arrow_forward_ios
Recommended textbooks for you
- MATLAB: An Introduction with ApplicationsStatisticsISBN:9781119256830Author:Amos GilatPublisher:John Wiley & Sons Inc
 Probability and Statistics for Engineering and th...StatisticsISBN:9781305251809Author:Jay L. DevorePublisher:Cengage Learning
 Statistics for The Behavioral Sciences (MindTap C...StatisticsISBN:9781305504912Author:Frederick J Gravetter, Larry B. WallnauPublisher:Cengage Learning
  Elementary Statistics: Picturing the World (7th E...StatisticsISBN:9780134683416Author:Ron Larson, Betsy FarberPublisher:PEARSON
 The Basic Practice of StatisticsStatisticsISBN:9781319042578Author:David S. Moore, William I. Notz, Michael A. FlignerPublisher:W. H. Freeman
 Introduction to the Practice of StatisticsStatisticsISBN:9781319013387Author:David S. Moore, George P. McCabe, Bruce A. CraigPublisher:W. H. Freeman
MATLAB: An Introduction with Applications
Statistics
ISBN:9781119256830
Author:Amos Gilat
Publisher:John Wiley & Sons Inc
Probability and Statistics for Engineering and th...
Statistics
ISBN:9781305251809
Author:Jay L. Devore
Publisher:Cengage Learning
Statistics for The Behavioral Sciences (MindTap C...
Statistics
ISBN:9781305504912
Author:Frederick J Gravetter, Larry B. Wallnau
Publisher:Cengage Learning
Elementary Statistics: Picturing the World (7th E...
Statistics
ISBN:9780134683416
Author:Ron Larson, Betsy Farber
Publisher:PEARSON
The Basic Practice of Statistics
Statistics
ISBN:9781319042578
Author:David S. Moore, William I. Notz, Michael A. Fligner
Publisher:W. H. Freeman
Introduction to the Practice of Statistics
Statistics
ISBN:9781319013387
Author:David S. Moore, George P. McCabe, Bruce A. Craig
Publisher:W. H. Freeman