MATLAB: An Introduction with Applications
6th Edition
ISBN: 9781119256830
Author: Amos Gilat
Publisher: John Wiley & Sons Inc
expand_more
expand_more
format_list_bulleted
Question

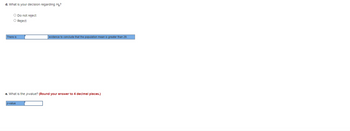
Transcribed Image Text:d. What is your decision regarding H₂?
O Do not reject
O Reject
There is
evidence to conclude that the population mean is greater than 29.
e. What is the p-value? (Round your answer to 4 decimal places.)
p-value

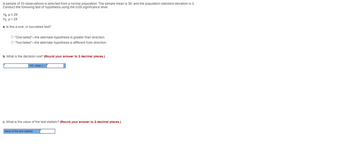
Transcribed Image Text:A sample of 33 observations selected from a normal population. The sample mean is 30, and the population standard deviation is 3.
Conduct the following test of hypothesis using the 0.05 significance level.
He: μ ≤ 29
H₁:μ> 29
a. Is this a one- or two-talled test?
O "One-tailed"-the alternate hypothesis is greater than direction.
O "Two-tailed"-the alternate hypothesis is different from direction.
b. What is the decision rule? (Round your answer to 2 decimal places.)
HO, when z>
c. What is the value of the test statistic? (Round your answer to 2 decimal places.)
Value of the test statistic
Expert Solution
This question has been solved!
Explore an expertly crafted, step-by-step solution for a thorough understanding of key concepts.
This is a popular solution
Trending nowThis is a popular solution!
Step by stepSolved in 4 steps with 7 images

Knowledge Booster
Similar questions
- answer 4arrow_forwardPeople spend an average of $11 on entertainment. You believe that for people who live in Arizona, this number is significantly lower. To test, you randomly sampled n=100 Arizona residents and asked them how much they spend on entertainment. The sample average of these respondents was $10.74 with a sample standard deviation of $1.2. If you want to test the null hypothesis that H0: u=11 vs Ha: u<11, what is the value of the test statistic?arrow_forwardThe following are the test scores of Janelle in all of her subjects. English - 45 Math - 42 Science – 48 Filipino - 50 АР 47 PE - 50 TLE - 43 VALUES - 44 Find the standard deviation of the test scores Record your answer on the table below: SUBJECTS (x – X) (x – X)² 1 2 4 6. 7. 8. A. Mean : В. N: C. Variance : D. Standard Deviation : E. What does the result of your standard deviation mean?arrow_forward
- Perform the following hypothesis test: HO: µ = 10 H1: µ 10 The sample mean is 9.55, population standard deviation of 1.5 and a sample size of 51. Use a 5% significance level. What is the value of the test statistic? (Give your answer rounded to 2 decimals) (Be careful to make sure your + or - sign is correct)What is the p-value for this problem?arrow_forwardYou wish to determine if there is a linear correlation between the two variables at a significance level of α=0.01α=0.01. You have the following bivariate data set. Round to three decimal places. x y 42.5 71 73.7 96 38.5 52.8 42.5 73 40 79.9 62.3 128.8 39.4 106.1 What is the critival value for this hypothesis test?rc.v. = ±± What is the correlation coefficient for this data set?arrow_forwardanswer 2arrow_forward
- PLEASE ANSWER THE QUESTION IN THE PHOTO. TY!arrow_forwardResearchers compared two groups of competitive rowers: a group of skilled rowers and a group of novices. The researchers measured the angular velocity of each subject’s right knee, which describes the rate at which the knee joint opens as the legs push the body back on the sliding seat. The sample size ?, the sample mean, and the sample standard deviation for the two groups are given below. Group N x̄ s Skilled 16 4.2 0.6 Novice 16 3.2 0.8 Construct the 99% confidence interval for the difference between the groups. How does this confidence interval relate to the conclusion of your test?arrow_forwardYou wish to determine if there is a linear correlation between the two variables at a significance level of a = 0.01. You have the following bivariate data set. X y 64.4 45.7 43.9 165.3 63.9 -15.5 65.5 12.6 64 73.9 63 25.9 59.9 34.8 45.1 99.2 What is the critival value for this hypothesis test? rc.v. = What is the correlation coefficient for this data set? r = Your final conclusion is that... O There is insufficient sample evidence to support the claim the there is a correlation between the two variables. There is sufficient sample evidence to support the claim that there is a statistically significant correlation between the two variables.arrow_forward
- I’m stuck on how to do this problem for stats.arrow_forwardTo answer the following questions, perform a x? test on the data. Be sure to show all your work and include the following information in your answer: x² value; number of degrees of freedom; P; whether the deviation is significant or nonsignificant; do you accept or reject the hypothesis. For each of the situations below, determine the degrees of freedom associated with the X² statistic and decide whether or not the observed x? value warrants acceptance or rejection of the hypothesized genetic ratio. 1. hypothesized ratio a. 3:1 7.0 b. 1:2:1 7.0 C. 1:1:1:1 7.0 d. 9:3:3:1 5.0 Degrees of Freedom Probability (P) Accept / Reject a. b. C. d.arrow_forwardNeed step by step directions to determine the P-value. Thanksarrow_forward
arrow_back_ios
SEE MORE QUESTIONS
arrow_forward_ios
Recommended textbooks for you
 MATLAB: An Introduction with ApplicationsStatisticsISBN:9781119256830Author:Amos GilatPublisher:John Wiley & Sons Inc
 Probability and Statistics for Engineering and th...StatisticsISBN:9781305251809Author:Jay L. DevorePublisher:Cengage Learning
 Statistics for The Behavioral Sciences (MindTap C...StatisticsISBN:9781305504912Author:Frederick J Gravetter, Larry B. WallnauPublisher:Cengage Learning
 Elementary Statistics: Picturing the World (7th E...StatisticsISBN:9780134683416Author:Ron Larson, Betsy FarberPublisher:PEARSON
 The Basic Practice of StatisticsStatisticsISBN:9781319042578Author:David S. Moore, William I. Notz, Michael A. FlignerPublisher:W. H. Freeman
 Introduction to the Practice of StatisticsStatisticsISBN:9781319013387Author:David S. Moore, George P. McCabe, Bruce A. CraigPublisher:W. H. Freeman

MATLAB: An Introduction with Applications
Statistics
ISBN:9781119256830
Author:Amos Gilat
Publisher:John Wiley & Sons Inc

Probability and Statistics for Engineering and th...
Statistics
ISBN:9781305251809
Author:Jay L. Devore
Publisher:Cengage Learning

Statistics for The Behavioral Sciences (MindTap C...
Statistics
ISBN:9781305504912
Author:Frederick J Gravetter, Larry B. Wallnau
Publisher:Cengage Learning

Elementary Statistics: Picturing the World (7th E...
Statistics
ISBN:9780134683416
Author:Ron Larson, Betsy Farber
Publisher:PEARSON

The Basic Practice of Statistics
Statistics
ISBN:9781319042578
Author:David S. Moore, William I. Notz, Michael A. Fligner
Publisher:W. H. Freeman

Introduction to the Practice of Statistics
Statistics
ISBN:9781319013387
Author:David S. Moore, George P. McCabe, Bruce A. Craig
Publisher:W. H. Freeman