
MATLAB: An Introduction with Applications
6th Edition
ISBN: 9781119256830
Author: Amos Gilat
Publisher: John Wiley & Sons Inc
expand_more
expand_more
format_list_bulleted
Related questions
Concept explainers
Question
What is the P-value?
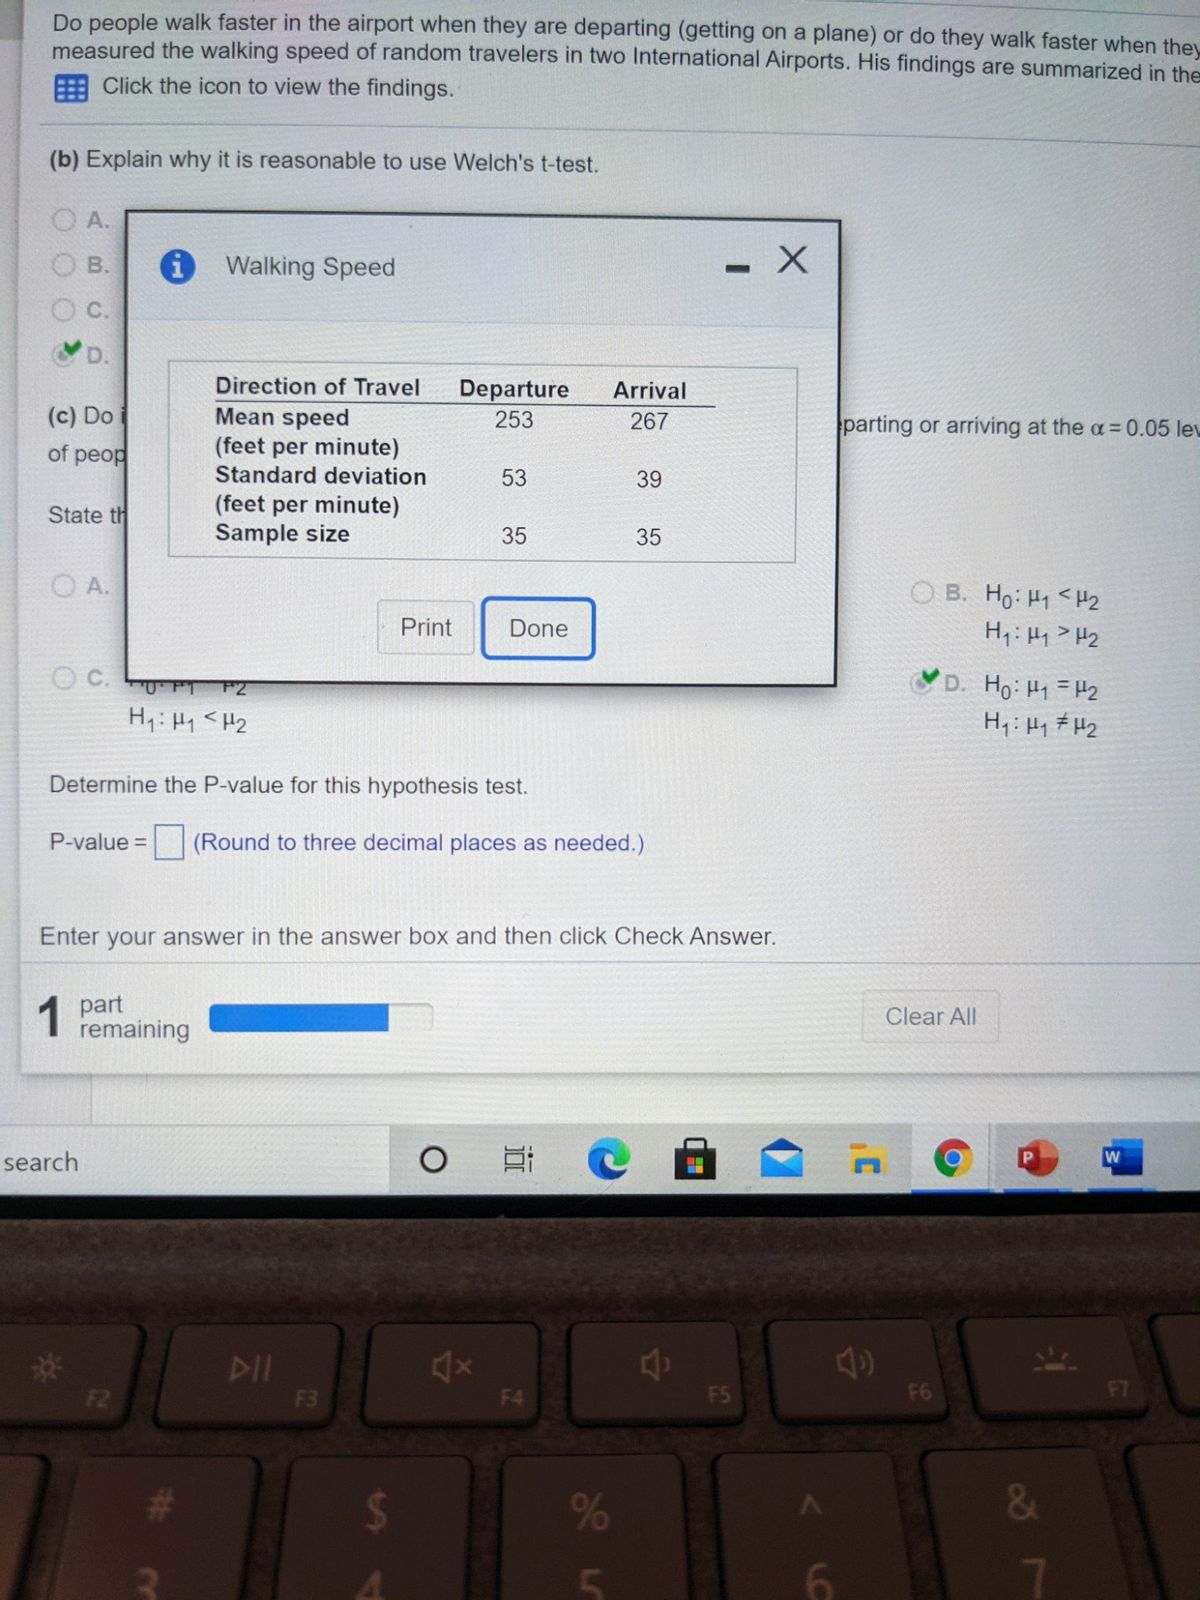

Transcribed Image Text:Do people walk faster in the airport when they are departing (getting on a plane) or do they walk faster when they
measured the walking speed of random travelers in two International Airports. His findings are summarized in the
Click the icon to view the findings.
(b) Explain why it is reasonable to use Welch's t-test.
O A.
O B.
i Walking Speed
C.
D.
Direction of Travel
Departure
Arrival
(c) Do
of peop
Mean speed
(feet per minute)
Standard deviation
253
267
parting or arriving at the a=0.05 lev
53
39
(feet per minute)
Sample size
State th
35
35
O A.
O B. Ho: H1 <H2
H,: H1>H2
Print
Done
C.
D. Ho: H1 H2
H,:Hq # H2
0FT
F2
H: Hy <H2
Determine the P-value for this hypothesis test.
P-value =
(Round to three decimal places as needed.)
Enter your answer in the answer box and then click Check Answer.
1 part
remaining
Clear All
search
W
%23
DII
F2
F3
F4
F5
F6
F7
%
&
Expert Solution
This question has been solved!
Explore an expertly crafted, step-by-step solution for a thorough understanding of key concepts.

Step by stepSolved in 2 steps with 1 images

Knowledge Booster


Learn more about
Need a deep-dive on the concept behind this application? Look no further. Learn more about this topic, statistics and related others by exploring similar questions and additional content below.Similar questions
- okay but is the p value GIVEN by the t test lower?arrow_forwardA standardized exam's scores are normally distributed. In a recent year, the mean test score was 1482 and the standard deviation was 315. The test scores of four students selected at random are 1910, 1200, 2210, and 1390. Find the z-scores that correspond to each value and determine whether any of the values are unusual. The z-score for 1910 is (Round to two decimal places as needed.)arrow_forwardPlzzz explain.arrow_forward
- The expression S(Xi) directs us to find the sum of scores median average of the scores middle scorearrow_forwardA survey was conducted among 68 patients admitted to a hospital cardiac unit during a two-week period. The data of the survey are shown below. Let B= the set of patients with high blood pressure. Let C= the set of patients with high cholesterol levels. Let S = the set of patients who smoke cigarettes. Answer parts (a)-(d) below. n(BNS) = 11 n(B n C) = 11 n(B ncns) = 6 n[(B nC) U (BNS) u (CNS)] = 20 n(B) = 30 n(C) = 28 n(S) = 31 ... (a) Find the number of these patients that had either high blood pressure or high cholesterol levels, but not both. The number of patients that had high blood pressure or high cholesterol levels, but not both, is 41 Aarrow_forwardYou are testing the claim that the proportion of men who own cats is larger than the proportion of women who own cats.You sample 150 men, and 80% own cats.You sample 190 women, and 55% own cats.Find p¯ (p-bar), as a decimal, rounded to two decimal places.arrow_forward
- Night Owls proportion of MSU students who regularly sleep less than 8 hours each night is less than the value reported by the MSU psychologist. She randomly selects 215 students and asks them, "Do you regularly sleep less than 8 hours each night?" She finds that 77 of the 215 students answered "yes" to the question. A MSU psychologist reports that 40% of MSU students regularly sleep less than 8 hours each night. Cindy believes that the actual 1. Which one of the following statements about the number 40% is correct? A. It is a sample statistic. B. It is a standard error. C. It is a margin of error. D. It is a claimed parameter. 2. Choose the null and alternative hypotheses Cindy should use to test her theory. А. Но : р %3D 0.4, Нд : р+0.4 В. Но : р %3D 0.4, На : р 0.4 3. If you assume that the observations in the sample are independent, what is the smallest value the sample size could be to meet the conditions for this hypothesis test? OA. 28 В. 10 C. None of the above D. 20 Е. 77 OF.…arrow_forwardHow do I compute this answer?arrow_forwardWhat is the p value for the following scenario: Out of 300 male inpatients, there are 195 that have a MCC and out of 450 female inpatients 205 have a MCC.arrow_forward
- I need help with all of them plz.arrow_forwardYou are testing the claim that the proportion of men who own cats is larger than the proportion of women who own cats. You sample 110 men, and 25% own cats. You sample 150 women, and 85% own cats. Find p (p-bar), as a decimal, rounded to two decimal places.arrow_forwardYou want to determine if there is a difference in the number of times statistics students get asked out on dates compared to biology students. You randomly survey four statistics students and four biology students. Data are listed on the table. Statistics Biology students studentsX Y8 144 108 64 10Conduct an independent t-test to see if there is a significant difference. (Be sure to complete all 4 steps.)arrow_forward
arrow_back_ios
SEE MORE QUESTIONS
arrow_forward_ios
Recommended textbooks for you
- MATLAB: An Introduction with ApplicationsStatisticsISBN:9781119256830Author:Amos GilatPublisher:John Wiley & Sons Inc
 Probability and Statistics for Engineering and th...StatisticsISBN:9781305251809Author:Jay L. DevorePublisher:Cengage Learning
 Statistics for The Behavioral Sciences (MindTap C...StatisticsISBN:9781305504912Author:Frederick J Gravetter, Larry B. WallnauPublisher:Cengage Learning
  Elementary Statistics: Picturing the World (7th E...StatisticsISBN:9780134683416Author:Ron Larson, Betsy FarberPublisher:PEARSON
 The Basic Practice of StatisticsStatisticsISBN:9781319042578Author:David S. Moore, William I. Notz, Michael A. FlignerPublisher:W. H. Freeman
 Introduction to the Practice of StatisticsStatisticsISBN:9781319013387Author:David S. Moore, George P. McCabe, Bruce A. CraigPublisher:W. H. Freeman
MATLAB: An Introduction with Applications
Statistics
ISBN:9781119256830
Author:Amos Gilat
Publisher:John Wiley & Sons Inc
Probability and Statistics for Engineering and th...
Statistics
ISBN:9781305251809
Author:Jay L. Devore
Publisher:Cengage Learning
Statistics for The Behavioral Sciences (MindTap C...
Statistics
ISBN:9781305504912
Author:Frederick J Gravetter, Larry B. Wallnau
Publisher:Cengage Learning
Elementary Statistics: Picturing the World (7th E...
Statistics
ISBN:9780134683416
Author:Ron Larson, Betsy Farber
Publisher:PEARSON
The Basic Practice of Statistics
Statistics
ISBN:9781319042578
Author:David S. Moore, William I. Notz, Michael A. Fligner
Publisher:W. H. Freeman
Introduction to the Practice of Statistics
Statistics
ISBN:9781319013387
Author:David S. Moore, George P. McCabe, Bruce A. Craig
Publisher:W. H. Freeman