
Chemistry
10th Edition
ISBN: 9781305957404
Author: Steven S. Zumdahl, Susan A. Zumdahl, Donald J. DeCoste
Publisher: Cengage Learning
expand_more
expand_more
format_list_bulleted
Related questions
Question

Transcribed Image Text:A
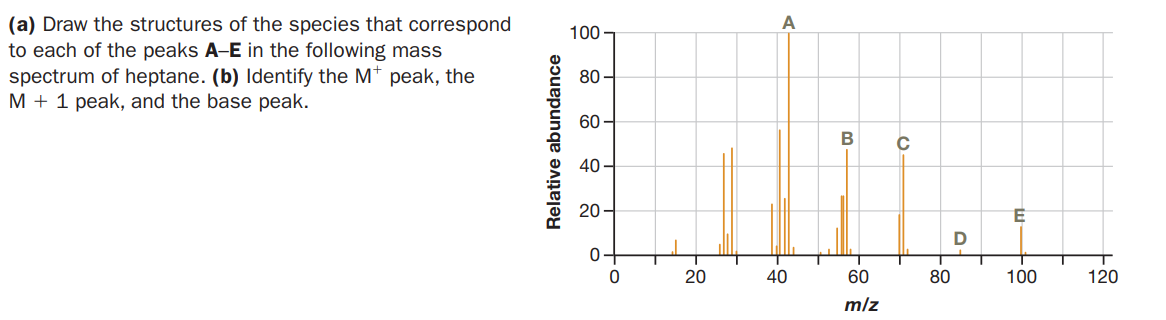
(a) Draw the structures of the species that correspond
to each of the peaks A-E in the following mass
spectrum of heptane. (b) Identify the M* peak, the
M + 1 peak, and the base peak.
100
80 –
60
40
20
D
20
40
60
80
100
120
m/z
Relative abundance
Expert Solution
This question has been solved!
Explore an expertly crafted, step-by-step solution for a thorough understanding of key concepts.

This is a popular solution

Trending nowThis is a popular solution!

Step by stepSolved in 3 steps with 1 images

Knowledge Booster

Similar questions
- Which one is the incorrect statement regarding mass spectrum? Question 25 options: In case of alcohols, M-18 peak is produced due to the loss of neutral H2O molecule (Dehydration) The relative heights of (M)+• peak and (M+1)+• peak is used to calculate the number of carbon atoms The structure likely contains a bromine atom if the (M+2)+• peak and (M)+• are almost similar in heights The molecular ion peak (M)+• always represent the base peak The structure likely contains a chlorine atom if the (M+2)+• peak is approximately one-third as tall as (M)+•arrow_forwardLOD 透过率/% D 12.2 Which compound is consistent with the spectrum shown below? 薄膜法 2000 1500 1000 500 /cm-¹ 4000 (a) 3000 (b) OH HO (c) OH (d) NH₂ 0= (e)arrow_forwardhelp please answer in text form with proper workings and explanation for each and every part and steps with concept and introduction no AI no copy paste remember answer must be in proper format with all workingarrow_forward
- 1. The EI-MS of methylcyclohexane is shown below. Locate the following information in it: CH3 (a) The molecular ion. (b) The base peak. (c) The Mt - C3H7 fragment ion. 83 100 55 80 60 98 40 27 69 20 60 70 80 90 100 20 30 40 50arrow_forward(a) Based on the mass spectrum shown below, 100 73 LOH 80 - A 58 20 - 100 10 20 30 40 50 60 70 80 90 100 110 m/z (i) identify the molecular ion peak of compound A. (ii) explain how the labelled fragments are formed. Relative Intensityarrow_forwardIdentify the expected base peak in the mass spectrum of 2,2,3-trimethylbutane. Draw the fragment associated with this peak and explain why the base peak results from this fragment.arrow_forward
arrow_back_ios
arrow_forward_ios
Recommended textbooks for you
- ChemistryChemistryISBN:9781305957404Author:Steven S. Zumdahl, Susan A. Zumdahl, Donald J. DeCostePublisher:Cengage Learning
 ChemistryChemistryISBN:9781259911156Author:Raymond Chang Dr., Jason Overby ProfessorPublisher:McGraw-Hill Education
 Principles of Instrumental AnalysisChemistryISBN:9781305577213Author:Douglas A. Skoog, F. James Holler, Stanley R. CrouchPublisher:Cengage Learning
  Organic ChemistryChemistryISBN:9780078021558Author:Janice Gorzynski Smith Dr.Publisher:McGraw-Hill Education
 Chemistry: Principles and ReactionsChemistryISBN:9781305079373Author:William L. Masterton, Cecile N. HurleyPublisher:Cengage Learning
 Elementary Principles of Chemical Processes, Bind...ChemistryISBN:9781118431221Author:Richard M. Felder, Ronald W. Rousseau, Lisa G. BullardPublisher:WILEY
Chemistry
Chemistry
ISBN:9781305957404
Author:Steven S. Zumdahl, Susan A. Zumdahl, Donald J. DeCoste
Publisher:Cengage Learning
Chemistry
Chemistry
ISBN:9781259911156
Author:Raymond Chang Dr., Jason Overby Professor
Publisher:McGraw-Hill Education
Principles of Instrumental Analysis
Chemistry
ISBN:9781305577213
Author:Douglas A. Skoog, F. James Holler, Stanley R. Crouch
Publisher:Cengage Learning
Organic Chemistry
Chemistry
ISBN:9780078021558
Author:Janice Gorzynski Smith Dr.
Publisher:McGraw-Hill Education
Chemistry: Principles and Reactions
Chemistry
ISBN:9781305079373
Author:William L. Masterton, Cecile N. Hurley
Publisher:Cengage Learning
Elementary Principles of Chemical Processes, Bind...
Chemistry
ISBN:9781118431221
Author:Richard M. Felder, Ronald W. Rousseau, Lisa G. Bullard
Publisher:WILEY