Elements Of Electromagnetics
7th Edition
ISBN: 9780190698614
Author: Sadiku, Matthew N. O.
Publisher: Oxford University Press
expand_more
expand_more
format_list_bulleted
Concept explainers
Question

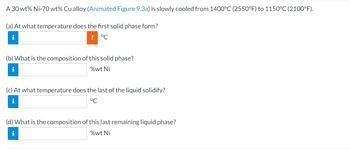
Transcribed Image Text:## Phase Change in a Nickel-Copper Alloy
A 30 wt% Ni-70 wt% Cu alloy is gradually cooled from 1400°C (2550°F) to 1150°C (2100°F).
### Questions
**(a)** At what temperature does the first solid phase form?
(Input your answer in °C)
**(b)** What is the composition of this solid phase?
(Input your answer in %wt Ni)
**(c)** At what temperature does the last of the liquid solidify?
(Input your answer in °C)
**(d)** What is the composition of this last remaining liquid phase?
(Input your answer in %wt Ni)
### Explanation
- **Illustration**: The exercise is based on theoretical data which might be derived from phase diagrams, specifically addressing when certain phase transformations occur as temperature changes.
- **Focus Points**: Determining phase formation temperatures and compositions is crucial for understanding alloy behaviors and properties during cooling processes.

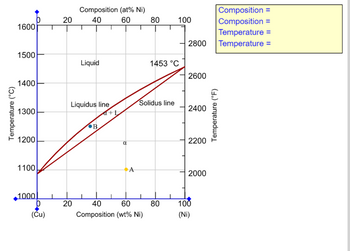
Transcribed Image Text:### Cu-Ni Phase Diagram
This phase diagram illustrates the phase behavior of a copper-nickel (Cu-Ni) alloy as a function of temperature and composition.
#### Axes:
- The x-axis represents the composition of nickel in the alloy, displaying two scales:
- Atomic percent (at% Ni) from 0 to 100.
- Weight percent (wt% Ni) from 0 to 100.
- The left y-axis shows the temperature in degrees Celsius (°C) ranging from 1000°C to 1600°C.
- The right y-axis shows the temperature in degrees Fahrenheit (°F) ranging from 2000°F to 2800°F.
#### Key Lines:
- **Liquidus Line**: Marks the boundary above which the alloy is entirely liquid.
- **Solidus Line**: Marks the boundary below which the alloy is entirely solid.
- The region between these lines represents a phase where both solid and liquid phases coexist, denoted as α + L.
#### Phases:
- **Liquid Phase**: Found above the liquidus line.
- **Solid Phase (α)**: Found below the solidus line.
- **Two-Phase Region (α + L)**: Exists between the liquidus and solidus lines.
#### Notable Points:
- **Point A**: Located in the solid phase region.
- **Point B**: Located in the two-phase region (α + L), showing the presence of both solid and liquid phases.
#### Temperature:
- The maximum labeled temperature is 1453°C at the 100% Ni point on the phase diagram.
#### Composition and Temperature Labels:
- Near the top right corner, there is a yellow box for providing specific composition and temperature values, currently left blank for customization.
This diagram is crucial for understanding the melting and solidification behaviors of Cu-Ni alloys, which is vital for applications requiring controlled alloying and thermal properties.
Expert Solution
This question has been solved!
Explore an expertly crafted, step-by-step solution for a thorough understanding of key concepts.
This is a popular solution
Trending nowThis is a popular solution!
Step by stepSolved in 5 steps with 5 images

Knowledge Booster
Learn more about
Need a deep-dive on the concept behind this application? Look no further. Learn more about this topic, mechanical-engineering and related others by exploring similar questions and additional content below.Similar questions
- 1 Al-Li Aerospace Alloys When a small amount of Li is added into Al to create an Al-Li alloy, the two elements typically do not mix homogeneously. Instead, most of the material is nearly-pure Al, while some small regions are Li-rich.¹ (These small regions are called precipitates and they are responsible for giving Al-Li alloys much better properties for aerospace applications relative to pure Al. We'll learn more about the alloying process and about precipitates later in the course.) The Li-rich regions have the chemical formula Al3Li and belong to the cubic crystal system.² In the unit cell, the Li atoms are located at 000, while the Al atoms are located at 110, 101, and 01121. (a) Draw the unit cell of Al3Li. (b) Which of the crystal structures from Callister Chapter 3 does this resemble? Why do we not call it that structure? (c) Given that the lattice parameter is 0.401 nm, what is the density of Al3Li?arrow_forwardA NIO-20 mol % Mgo ceramic is allowed to solidify. (See the figure below.) Temperature (°C) 2800 2600 2400- 2200 2000 L (Ni, Mg)0 40 60 80 MgO Mole percent MgO NIO 20 (a) Determine the composition (in mol% MgO) of the first solid to form. 80 x (b) Determine the composition (in mol% MgO) of the last liquid to solidify under equilibrium conditions. 35 X%arrow_forwardUse the Lead-Tin (Pb-Sn) phase diagram below to answer the following questions: Place the following microstructures in the correct order of formation for slowly cooling a 98 wt% Sn alloy from 300 °C to room temperature (point A to point B).arrow_forward
- Hi i keep getting these wrongarrow_forwardAccording to the following graph, two samples of 1080 steel are cooled from the eutectoid temperature, one at a cooling rate of 250°C/s and the other at a cooling rate of 7.27x10⁻⁸ °C/s. Specify the phases obtained and explain their formation from thermodynamic and kinetic perspectives. Also, briefly describe their formation. Draw the microstructure of the phases obtained. Sıcaklık (C) 800 700 600 500 400 300 200 100 0 10 1 T M(başlama) M(% 50) M(% 90) 10 M+O -Otektoid Sıcaklık 10² Zaman (s) % 50 10³ 104 105arrow_forwardQI/ Draw a thermal equilibrium diagram for the binary alloy system (Si –Au), from the following data:- a- Si melts at 1414 °C, and Au melts at 1064 °C , and identify all phases are present in the diagram. b- Eutectic is formed at 360°C containing 20 Wt% Si -80 Wt% Au . c- Determine the amount of each phase for the alloy which consist 60 Wt% Si- 40Wt % Au at 1200 °C and 800 °C ,then determine the amount of eutectic at 200 °C?arrow_forward
- A 50 wt% Pb-50 wt% Mg alloy is slowly cooled from 700 °C (1290 °F) to 400 °C (750 °F). (a) At what temperature does the first solid phase form? (b) What is the composition of this solid phase? (c) At what temperature does the liquid solidify? (d) What is the composition of this last remaining liquid phase? Temperature (°C) 700 600 500 400 300 200 100 2 0 0 (Mg) 560°C First solid (21 wt% Pb) α 20 465°C 5 a + L Composition (at% Pb) 40 10 L a + Mg₂Pb 20 60 Composition (wt% Pb) Last liquid (67 wt% Pb) 30 Mg₂Pb 40 T T L + Mg₂Pb M 18 80 L + Mg₂Pb 70 100 B B+ Mg₂Pb T B + L D T 1200 1000 800 600 400 200 100 (Pb) Temperature (°F)arrow_forwardIn Figure 1 (phase diagram), an alloy composition of 95 wt% Mg and 5 wt% Al is cooled from 700 C to 475 C. An analysis of the resulting ε solid-phase composition reveals that it has a higher Mg content than is anticipated by the phase diagram.a) Explain why this might be the case and how your reasoning results in the higher-than-expected Mg content.b) Provide a sketch showing the likely distribution of Mg content within the volume of ε solid-phase.arrow_forwardAn alloy consisting of completely soluble cadmium (Cd) and zinc (Zn) in the liquid state, but neither of them dissolves in each other in the solid state. the table shown below shows the solidification temperatures for various alloys of cadmium and zinc. 1. Draw the equilibrium diagram according to the information given and data in the table and indicating all important temperature and phases. 2. Find the percentage of each phases and percentage of constituents of the alloy that contain 60 % Zn and at a temperature 300 °C. 3. Find the melting point for the following alloys 20 % Cd, 80% Cd 4. Draw the internal structure, noting the phases of the following alloys A) 30 % Cd at 290 °C b) 60 % Cd at room temperature. % of Zinc in alloy Start of solidification ("C) End of solidification ("C) 0 10 14 20 30 40 50 60 321 290 266 275 293 310 328 345 70 80 90 100 362 390 401 419 266 266 266 266 266 266 266 266 266 266 266 266arrow_forward
- Is it possible to have a copper-nickel alloy that, at equilibrium, consists of a liquid phase of composition 20 wt% Ni-80 wt% Cu and also an a phase of composition 37 wt% Ni-63 wt% Cu? If so, what will be the approximate temperature of the alloy? If this is not possible, explain why. Temperature (°C) 1600 1500 1400 1300 1200 1100 1000 0 1085°C (Cu) 20 Liquid Liquidus line L B 40 a+L a A 60 Composition (wt% Ni) (a) 1455°C Solidus line 80 2800 2600 2400 2200 2000 100 (Ni) Temperature (°F) Temperature (°C) 1300 1200 20 Liquid Tie line. a + Liquid a 1 KR I 1 1 B ↑ Co a + Liquid -S 30 CL Composition (wt% Ni) (b) 40 1 Ca a 50arrow_forwardMaterial science Assuming this system forms a laminar type eutectic, determine the volume proportion of phases for an equilibrium solidified 50% Pb alloy. Sketch the expected microstructure.arrow_forwardConsider 2.0 kg of austenite containing 0.5 wt% C and cooled to just below 727°C (1341°F). (a) What is the proeutectoid phase? (b) How many kilograms each of pearlite, the proeutectoid phase, and cementite form?arrow_forward
arrow_back_ios
SEE MORE QUESTIONS
arrow_forward_ios
Recommended textbooks for you
 Elements Of ElectromagneticsMechanical EngineeringISBN:9780190698614Author:Sadiku, Matthew N. O.Publisher:Oxford University Press
 Mechanics of Materials (10th Edition)Mechanical EngineeringISBN:9780134319650Author:Russell C. HibbelerPublisher:PEARSON
 Thermodynamics: An Engineering ApproachMechanical EngineeringISBN:9781259822674Author:Yunus A. Cengel Dr., Michael A. BolesPublisher:McGraw-Hill Education
 Control Systems EngineeringMechanical EngineeringISBN:9781118170519Author:Norman S. NisePublisher:WILEY
 Mechanics of Materials (MindTap Course List)Mechanical EngineeringISBN:9781337093347Author:Barry J. Goodno, James M. GerePublisher:Cengage Learning
 Engineering Mechanics: StaticsMechanical EngineeringISBN:9781118807330Author:James L. Meriam, L. G. Kraige, J. N. BoltonPublisher:WILEY

Elements Of Electromagnetics
Mechanical Engineering
ISBN:9780190698614
Author:Sadiku, Matthew N. O.
Publisher:Oxford University Press

Mechanics of Materials (10th Edition)
Mechanical Engineering
ISBN:9780134319650
Author:Russell C. Hibbeler
Publisher:PEARSON

Thermodynamics: An Engineering Approach
Mechanical Engineering
ISBN:9781259822674
Author:Yunus A. Cengel Dr., Michael A. Boles
Publisher:McGraw-Hill Education

Control Systems Engineering
Mechanical Engineering
ISBN:9781118170519
Author:Norman S. Nise
Publisher:WILEY

Mechanics of Materials (MindTap Course List)
Mechanical Engineering
ISBN:9781337093347
Author:Barry J. Goodno, James M. Gere
Publisher:Cengage Learning

Engineering Mechanics: Statics
Mechanical Engineering
ISBN:9781118807330
Author:James L. Meriam, L. G. Kraige, J. N. Bolton
Publisher:WILEY