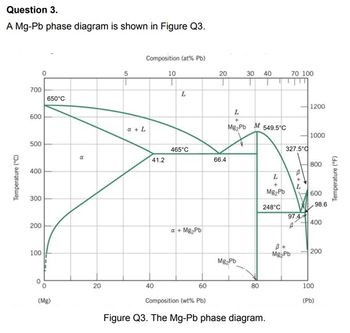
BINARY PHASE DIAGRAMS
Please only answer parts d and e as the rest have been solved.
Show full detailed explanation to answers with diagrams if necessary
a)(i) What is the melting point of pure Mg?
(ii) What is the maximum solubility of Mg in Pb and at what temperature
does this occur?
(b) A 50 wt.% Pb-50wt% Mg alloy is slowly cooled from 700 °C to 400 °C.
(i) At what temperature does the first solid phase form?
(ii) What is the composition of this solid phase?
(iii) At what temperature does all the liquid solidify?
(iv) What is the composition of the last remaining liquid phase?
(v) What is the freezing range? (c) What is the mass fraction of solid and liquid of a 60 wt.% Mg alloy at a
temperature of 500 °C.
(d) Draw and label the microstructure of an 80 wt.% Mg alloy at 600 °C.
(e) A Mg-Pb alloy of mass 5.5 kg has a composition just slightly below the
solubility limit of 200 °C.
(i) What mass of lead is in the alloy?
(ii) If the alloy is heated to 350 °C how much more lead can be dissolved
in the α phase without exceeding the solubility limit of this phase?

Step by stepSolved in 4 steps with 3 images

- According to the following graph, two samples of 1080 steel are cooled from the eutectoid temperature, one at a cooling rate of 250°C/s and the other at a cooling rate of 7.27x10⁻⁸ °C/s. Specify the phases obtained and explain their formation from thermodynamic and kinetic perspectives. Also, briefly describe their formation. Draw the microstructure of the phases obtained. Sıcaklık (C) 800 700 600 500 400 300 200 100 0 10 1 T M(başlama) M(% 50) M(% 90) 10 M+O -Otektoid Sıcaklık 10² Zaman (s) % 50 10³ 104 105arrow_forwardReferring to Figure 1, please answer the following [NOTE: SHOW YOUR WORK on Figure 1]:a. provide the specific name for the phase boundary lines denoted by A and B. b. identify the phases present at equilibrium in the phase fields denoted by C, D, and E. c. identify the specific name for the point denoted by F. d. What is the maximum solid solubility of Mg in Al? At what temperature does it occur? e. An Al-Mg alloy (10 wt% Mg, 90 wt% Al) is heated slowly (to insure equilibrium) from a temperature of 200 C: i. At what temperature does the first liquid phase form? ii. What is the composition of the liquid phase at the temperature in part i.? iii. At what temperature does complete melting (no solid phase remaining) occur? iv. What is the composition of the last solid remaining prior to complete melting? f. Using the equilibrium phase diagram of Figure 1, identify the phases present, their compositions, and their relative mass fractions at equilibrium for a 70 wt% Mg – 30 wt% Al…arrow_forwardGiven the equilibrium phase diagram (a) below, briefly describe the mechanisms of precipitation hardening/strengthening of an aluminium alloy making reference to the transitions shown in (b) below to X, X to A, X to D, A to B and A to C. а +0 D B Time (a) (b) - anedua Temperaturearrow_forward
- An alloy consisting of completely soluble cadmium (Cd) and zinc (Zn) in the liquid state, but neither of them dissolves in each other in the solid state. the table shown below shows the solidification temperatures for various alloys of cadmium and zinc. 1. Draw the equilibrium diagram according to the information given and data in the table and indicating all important temperature and phases. 2. Find the percentage of each phases and percentage of constituents of the alloy that contain 60 % Zn and at a temperature 300 °C. 3. Find the melting point for the following alloys 20 % Cd, 80% Cd 4. Draw the internal structure, noting the phases of the following alloys A) 30 % Cd at 290 °C b) 60 % Cd at room temperature. % of Zinc in alloy Start of solidification ("C) End of solidification ("C) 0 10 14 20 30 40 50 60 321 290 266 275 293 310 328 345 70 80 90 100 362 390 401 419 266 266 266 266 266 266 266 266 266 266 266 266arrow_forward5. [Phase Diagram] (1) Here is Cu-Ag phase diagram and two cases (composition and temperature) are given below. At each case, (i) cite the phase(s) present(s), (ii) estimate the phase composition(s), (iii) weight fraction of the phase(s) and (iv) sketch its microstructure for the following alloy. () a. 71.9 wt% Ag-28.1 wt% Cu at just above 779 °C b. 71.9 wt% Ag-28.1 wt% Cu at just below 779 °℃ Temperature (°C) 1200 A 1000 800 600 400 0 200 0 α C (Cu) B 8.0 (Ca E) -Solidus Solvus 20 20 a + L Composition (at% Ag) -Liquidus 779°C (TE) 40 40 a + B Liquid 60 Composition (wt% Ag) 60 E 71.9 (CE) 80 80 B+L 91.2 (CBE) G 100 B H 2200 2000 1800 F 1600 1400 1200 1000 800 600 400 100 (Ag) Temperature (°F)arrow_forwardMaterial science Assuming this system forms a laminar type eutectic, determine the volume proportion of phases for an equilibrium solidified 50% Pb alloy. Sketch the expected microstructure.arrow_forward
 Elements Of ElectromagneticsMechanical EngineeringISBN:9780190698614Author:Sadiku, Matthew N. O.Publisher:Oxford University Press
 Mechanics of Materials (10th Edition)Mechanical EngineeringISBN:9780134319650Author:Russell C. HibbelerPublisher:PEARSON
 Thermodynamics: An Engineering ApproachMechanical EngineeringISBN:9781259822674Author:Yunus A. Cengel Dr., Michael A. BolesPublisher:McGraw-Hill Education
 Control Systems EngineeringMechanical EngineeringISBN:9781118170519Author:Norman S. NisePublisher:WILEY
 Mechanics of Materials (MindTap Course List)Mechanical EngineeringISBN:9781337093347Author:Barry J. Goodno, James M. GerePublisher:Cengage Learning
 Engineering Mechanics: StaticsMechanical EngineeringISBN:9781118807330Author:James L. Meriam, L. G. Kraige, J. N. BoltonPublisher:WILEY


