
Related questions
Concept explainers
Answer A-1 and C-1 Please
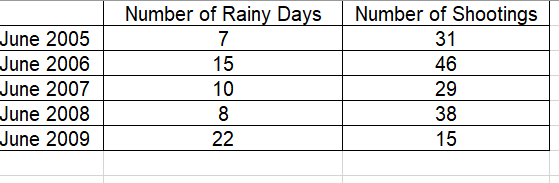
In June 2009, an onslaught of miserable weather in New England played havoc with people’s plans and psyches. However, the dreary weather brought a quiet benefit to many city neighborhoods. Police reported that the weather was a key factor in reducing fatal and nondeadly shootings (The Boston Globe, July 3, 2009). For instance, it rained in Boston on 22 days in June, when 15 shootings occurred. In 2008, the city saw rain on only eight days, and 38 shootings occurred. The table below shows the number of rainy days and the number of shootings that occurred in June from 2005 to 2009. [You may find it useful to reference the t table.]
| Number of Rainy Days | Number of Shootings | |||||
| June 2005 | 7 | 31 | ||||
| June 2006 | 15 | 46 | ||||
| June 2007 | 10 | 29 | ||||
| June 2008 | 8 | 38 | ||||
| June 2009 | 22 | 15 | ||||
SOURCE: The Boston Globe, July 3, 2009.
Click here for the Excel Data File
a-1. Calculate the sample
a-2. Interpret the sample correlation coefficient between the number of rainy days and crime.
multiple choice 1
-
The correlation coefficient indicates a positive linear relationship.
-
The correlation coefficient indicates a negative linear relationship. Correct
-
The correlation coefficient indicates no linear relationship.
b. Specify the competing hypotheses in order to determine whether the population correlation coefficient between the number of rainy days and crime is negative.
multiple choice 2
-
H0: ρxy ≥ 0; HA: ρxy < 0 Correct
-
H0: ρxy ≤ 0; HA: ρxy > 0
-
H0: ρxy = 0; HA: ρxy ≠ 0
c-1. Calculate the value of the test statistic. (Negative value should be indicated by a minus sign. Round intermediate calculations to at least 4 decimal places and final answer to 3 decimal places.)


Trending nowThis is a popular solution!

Step by stepSolved in 2 steps


- A gym wishes to evaluate the effectiveness of its programs. When a new member joins the gym, they meet with a trainer who designs a recommended routine based on the member’s current fitness and their goals. The recommended routines can be classified into high, medium, or low effort. Historically, 68% of the new members get a high effort routine, 21% get a medium effort routine, and the rest get a low effort routine. After the first six months as members, the gym surveys the members’ adherence to the recommended routine. The gym classifies a member’s performance as optimal if they follow the recommended routine for the six months, or as inferior otherwise. According to the historical results of the survey, 84% of the members with a low effort routine, 22% of the members with a medium effort routine, and 69% of the members with a high effort routine report optimal performance. After the first six months of joining the gym, a member can obtain different results: they can either…arrow_forwardA social media app is conducting a study on the amount of time users spend on the app. They collect the following variables. Age Years: How old they are in years? Income: Monthly Income Location: What country do they live in? Device: Do they use an iPhone, Samsung, other? Service: Who provides their mobile phone service? For example: T-Mobile, At&t, Verizon, ect Hours: How many hours do they spend on the app per week. A) Which variable could the research construct a one proportion z-interval for? B) The social media app just launched a new algorithm that suggest content in an effort to increase the amount of time the user spends on the app. The researchers want to use the survey results to see if there is statistically significant evidence that on average users spend more than 10 hours per week on the social media app. The researchers found in their sample of 44 users, the mean hours spent on the app is 10.5 hours with a standard deviation of 5.675 hours. Which type of hypothesis test…arrow_forwardVirginia polled a large sample of individuals to find the percentage of students with known food allergies and the percentage of students without known food allergies. Which of the following could sufficiently display the data if only the two given categories are to be included? Select the correct answer below: bar graph pie chart either a pie chart or a bar graph neither a pie chart nor a bar grapharrow_forward
- We are interested in looking at the effect of a baseball player’s free agent status on their salary. We look at 337 baseball players and categorize them as either having a high salary (above 2 million) or not, and as either being free agents or not. ------------------------------ You also wonder if having a high batting average affects the salary of baseball players. You classify all 370 baseball players as having a high batting average if it is over .300. 1. What is the conditional distribution of high salary when looking only at those who have high batting averages? 2. What is the marginal distribution of high salary? 3. Give the four expected counts.arrow_forwardA campus researcher wanted to investigate the factors that affect visitor travel time in a complex, multilevel building on campus. Specifically, he wanted to determine whether different building signs (building maps versus wall signage) affect the total amount of time visitors require to reach their destination and whether that time depends on whether the starting location is inside or outside the building. Three subjects were assigned to each of the combinations of signs and starting locations, and travel time in seconds from beginning to destination was recorded. How should the data be analyzed? Wall Signs Map Starting Room Interior 141, 119, 238 85, 94, 126 Randomized block design O Completely randomized design 2 x 2 factorial design Levene's test Exterior 224, 339, 139 226, 129, 130arrow_forwardPractice question #1. Researchers at the University of Utah carried out a study to see if the size of the fork used to eat dinner influences how much food is consumed. The researchers assigned people to one of two groups. One group ate dinner using a small fork, and the other group ate using a large fork. The researchers found that thatthose who ate with a large fork ate less food on their plate than those who ate with a small fork. An articledescribing this study was called “Dieters Should Use a Big Fork”, implying cause-and-affect andgeneralizing this finding to the population of dieters. A. Under what circumstances would it be reasonable to conclude a cause-and-effect relationship between fork size and amount eaten? B. Under what circumstances would it be reasonable to generalize this finding to the population of dieters? Why is it often NOT appropriate to generalize the results of experiments to a wider population?arrow_forward
- Practice question #3 Investigators want to know if those who work long hours have more trouble sleeping. In one sample of 190 British civil servants who worked more than 40 hours a week, 95 of them said they usually get less than 7 hours of sleep per night. In a second sample of 150 British civil servants who worked between 35 and 40 hours per week, 63 of them said they usually get less than 7 hours of sleep per night. The investigators believe these are represent samples of the populations. Find a 95% Confidence Interval for the difference in proportions of these two populations that get less than 7 hours of sleep per night. Then interpret the confidence interval. Be sure to check that any necessary conditions are met first. Round final answers to 3 decimal places. Verify conditions are appropriate for method: Interval: ________________________ Does the interval contain zero? __________ What does this information lead you to conclude?arrow_forwardPart 1: The state of Maryland's arrest rate for marijuana possession in 2010 was the fourth highest in the nation. Public records for that year show that police arrested one out of every 250 Maryland residents for possession of marijuana. In addition, while Black people only comprised 30% of the State's population in 2010, 58% of those arrested for marijuana possession were Black. Use the following labels for events describing Maryland residents in the year 2010. M-AMP: Maryland resident was arrested for marijuana possession M-B: Maryland resident was a Black person a) What is the probability that a Maryland resident was arrested for marijuana possession in 2010? b) Use probability notation to express the cited percent values. 30% = P( 58% = P( c) Which of the values cited should be compared to determine whether race and arrests for marijuana possession in the state of Maryland in 2010 are independent?arrow_forwardThe percentage of employees who cease their employment during a year is referred to as employee turnover, and it is a serious issue for businesses. The following table shows the cost, in millions of dollars, to a certain company for a given employee turnover percentage in a year.arrow_forward
- Psychologists Erik Erikson suggested that individuals go through eight developmental stages of life. Erikson believed that at stage 8 (age 65 to death), an adult's fear of death can be predicted by the satisfaction they feel when reflecting back on their lives. To investigate, a psychiatrist interviewed a random sample of adults age 65 and older, and scored them on their satisfaction with their lives and their fear of death. The psychiatrist wants to confirm Erikson's theory. What can be concluded with a = 0.01? fear of death satisfied 4 3 4 2 2 10 3 2 4 7 3 4 8. 4 a) Select and compute the appropriate statistic. ---Select--- b) Input the appropriate value(s) to make a decision about Ho. p-value X ; Decision: Fail to reject H0 v c) Using the SPSS results, compute the corresponding effect size(s) and indicate magnitude(s). If not appropriate, input and/or select "na" below.. Effect Size = 0.266 ; Magnitude: na d) Make an interpretation based on the results. More life satisfaction…arrow_forwardWe are interested in looking at the effect of a baseball player’s free agent status on their salary. We look at 337 baseball players and categorize them as either having a high salary (above 2 million) or not, and as either being free agents or not. ------------------------------ You also wonder if having a high batting average affects the salary of baseball players. You classify all 370 baseball players as having a high batting average if it is over .300. 1. The given χ2test table gives many test statistics. The row we want to look at is labeled Pearson Chi-Square. Give the test statistic, the degrees of freedom, and the p-value. 2. At a significance level of .05, what can you conclude in the context of this problem?arrow_forwardExperimental or Observational: A group of students is interested in knowing if the number of times they can sink a basketball is related to the color of the basketball. The students shoot a series of baskets and record their success using a regulation colored basketball. They then switch to a blue colored basketball and shoot the same series of baskets. .arrow_forward
- MATLAB: An Introduction with ApplicationsStatisticsISBN:9781119256830Author:Amos GilatPublisher:John Wiley & Sons Inc
 Probability and Statistics for Engineering and th...StatisticsISBN:9781305251809Author:Jay L. DevorePublisher:Cengage Learning
 Statistics for The Behavioral Sciences (MindTap C...StatisticsISBN:9781305504912Author:Frederick J Gravetter, Larry B. WallnauPublisher:Cengage Learning
  Elementary Statistics: Picturing the World (7th E...StatisticsISBN:9780134683416Author:Ron Larson, Betsy FarberPublisher:PEARSON
 The Basic Practice of StatisticsStatisticsISBN:9781319042578Author:David S. Moore, William I. Notz, Michael A. FlignerPublisher:W. H. Freeman
 Introduction to the Practice of StatisticsStatisticsISBN:9781319013387Author:David S. Moore, George P. McCabe, Bruce A. CraigPublisher:W. H. Freeman