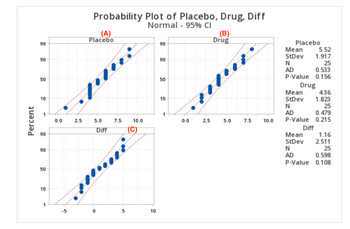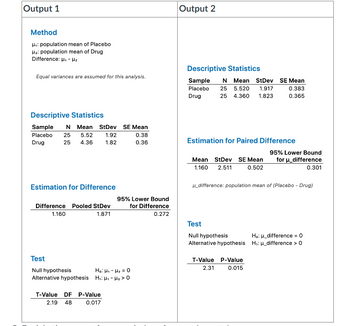
Please note that this question consists of seven parts. Use the MINITAB outputs provided to you to answer the question. Show all your work/explanation. Just giving the answer without adequate explanation work may result in zero for the question.
A company that manufactures a homeopathic drug claims that it can reduce the time takes to overcome jet lag from long distance flights. A researcher is interested in testing this claim.
He takes a random sample of 50 passengers making a trip from Las Vegas to Melbourne, Australia. He randomly assigns half of his sample to take the placebo and the remaining half to take the actual drug.
Then he collected the data on the number of days it took for them to recover from the jet lag from the trip.
Part of the data with some summary statistics is displayed below. Please note that some information may or may not be relevant.
| Placebo | Drug | Diff | |
| 4 | 5 | -1 | |
| 7 | 3 | 4 | |
| 6 | 8 | -2 | |
| . | . | . | |
| . | . | . | |
| 9 | 7 | 2 | |
| 4 | 1 | 3 | |
| Mean | 5.52 | 4.36 | 1.16 |
| SD | 1.917 | 1.823 | 2.511 |
- Are the two samples: Placebo and Drug, independent or dependent? Explain your answer
- From the provided plots: (A), (B) and (C), clearly state which plot/plots you would use to check any assumptions.
- Do you see any serious violations of those assumptions? Explain your answer without simply saying yes or no.
- Researcher is interested in testing the claim made by the company manufacturing the drug. To answer this question, which output: output 1 or output 2 would you use?
Output 1 Output 2 - Explain the reason for your choice of output in part 4.
- What is the p value for the test ? Write the probability statement for the p value for this test, and copy the numerical value of the p value from your choice of output.
- Using the p value you derived in part 6, what would be your conclusion to the researchers question at 5% significance level (write the conclusion in the context of the problem).


Step by stepSolved in 2 steps

- You are a paranoid delusional statistician with far too much time on your hands. One day, you sit down to have a bowl of soup. This bowl of soup happens to be Tic-Tac-Toe themed, meaning that you stir have some noodles that are shaped like an X, and some that are shaped like an O. As your soup, you notice that this bowl seems to have a particularly high number of X- you shaped noodles in it. Being paranoid, you conclude that this has some meaning-like someone is trying to give you a message, possibly warning you of the dangers of x-rays. You jump out of your seat and run to get your x-ray-proof cape, and then you pause for a moment and think that you should calculate a chi-square statistic for the frequency of X-shaped noodles before freaking out. First, you carefully separate each of the noodles by shape and count them. Here is what you find: Frequency of Noodles X-shaped O-shaped 33 21 1. What type of chi-square design is this (check one box)? OTwo-cell ОThree-cell OTwo-by-two…arrow_forwardBurning fuels in power plants and motor vehicles emits carbon dioxide (CO2), which contributes to global warming. The CO2 emissions (metric tons per capita) for countries varies from 0.02 in Burundi to 44.02 in Qatar. Although the data set includes 214 countries, the CO2 emissions of 15 countries are not available on the World Bank database. The data set is too large to display but the data for the first five countries is given. Use the full data set with data on the 214 countries to answer the questions. To access the complete data set, click the link for your preferred software format: Excel Minitab JMP SPSS TI R Mac-TXT PC-TXT CSV Crunchlt! Country CO2 Emissions (Metric Tons per Capita) Aruba 23.92 Andorra 5.97 Afghanistan 0.43 Angola 1.35 Albania 1.61 Find the mean and the median for the full data set. Round your answers to three decimal places. The mean for these data is tons per person The median for these data is tons per personarrow_forwardShrubs that Withstand Fire Fire is a serious threat to shrubs in dry climates. Some shrubs can resprout from their roots after their tops are destroyed. One study of resprouting took place in a dry area of Mexico. The investigators first clipped the tops of all the shrubs in the study. For the treatment, they then applied a propane torch to the stumps of the shrubs to simulate a fire, and for the control the stumps were left alone. The study included 24 shrubs of which 12 were randomly assigned to the treatment and the remaining 12 to the control. A shrub is a success if it resprouts. For the shrub Xerospirea hartwegiana, all 12 shrubs in the control group resprouted, whereas only 8 in the treatment group resprouted. How much does burning reduce the proportion of shrubs of this species that resprout? Give the 95% plus four confidence interval for the amount by which burning reduces the proportion of shrubs of this species that resprout. The plus four method is particularly helpful…arrow_forward
- Can someone please help me with part c on question 1?arrow_forwardPart 4 of 4 Summarize the results. There (Choose one) enough evidence to conclude that the second-graders in the superintendent's school district have h the nationwide average. differe is is notarrow_forwardI would like help with question 2 both A and B.arrow_forward
- Please answer the question. Asap. Thank you.arrow_forwardplease show work so i can understand. thank you !arrow_forwardI am having trouble solving this problem. Can you please provide me with some help? Thank you. I appreciate it. Almonte. Inc., a maker of low-priced hair care products, claims that its hair spray lasts as long as the industry leader's higher-priced product. You take a sample of 60 applications of Almonte's hair spray and 60 applications of the leading hair spray. Results: On average, the Almonte applications held for 12.7 hours with a standard deviation of 1.4 hours. On average, the leading hair spray lasted 11.8 hours with a standard deviation of 1.8 hours. Set up a hypothesis test to test whether the difference in sample means is statistically significant. Use a significance level of 1%. Report and explain your conclusion.arrow_forward
 MATLAB: An Introduction with ApplicationsStatisticsISBN:9781119256830Author:Amos GilatPublisher:John Wiley & Sons Inc
 Probability and Statistics for Engineering and th...StatisticsISBN:9781305251809Author:Jay L. DevorePublisher:Cengage Learning
 Statistics for The Behavioral Sciences (MindTap C...StatisticsISBN:9781305504912Author:Frederick J Gravetter, Larry B. WallnauPublisher:Cengage Learning
 Elementary Statistics: Picturing the World (7th E...StatisticsISBN:9780134683416Author:Ron Larson, Betsy FarberPublisher:PEARSON
 The Basic Practice of StatisticsStatisticsISBN:9781319042578Author:David S. Moore, William I. Notz, Michael A. FlignerPublisher:W. H. Freeman
 Introduction to the Practice of StatisticsStatisticsISBN:9781319013387Author:David S. Moore, George P. McCabe, Bruce A. CraigPublisher:W. H. Freeman


