
MATLAB: An Introduction with Applications
6th Edition
ISBN: 9781119256830
Author: Amos Gilat
Publisher: John Wiley & Sons Inc
expand_more
expand_more
format_list_bulleted
Related questions
Question
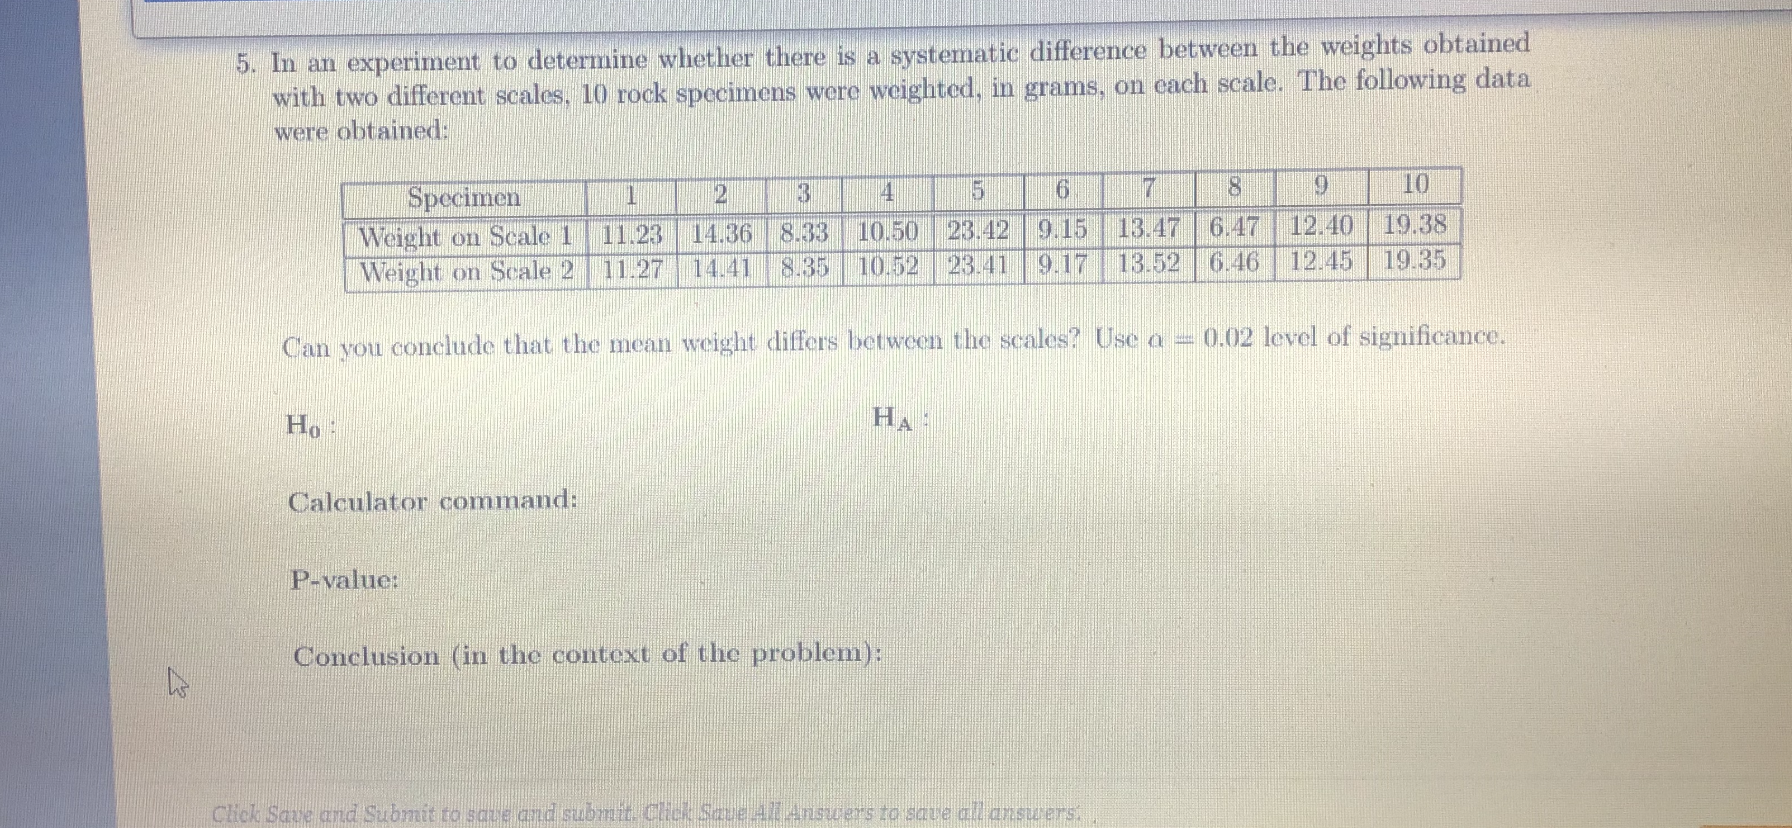

Transcribed Image Text:9.
Specimen
Weight on Scale 1
Weight on Scale 2
14.36
8.33
23.42 9.15
13.47
12.40
6.47
13.52 6.46
19.38
10.50
10.52 23.41
11.23
11.27 14.41
8.35
9.17
12.45
19.35
Expert Solution
This question has been solved!
Explore an expertly crafted, step-by-step solution for a thorough understanding of key concepts.

This is a popular solution

Trending nowThis is a popular solution!

Step by stepSolved in 7 steps with 3 images

Knowledge Booster


Learn more about
Need a deep-dive on the concept behind this application? Look no further. Learn more about this topic, statistics and related others by exploring similar questions and additional content below.Similar questions
- LESSON 2.3 DENSITY CURVES AND THE NORMAL DISTRIBUTION vad E.C 23J Learning Target 2.3.190 ST A VALOR When will an enemy appear? Modeling with density curves PROBLEM: Suppose that a timer for a video game has a randomly determined length of time, after which an enemy appears. The timer is programmed so that the enemy is equally likely to appear any time between 0.25 minutes and 2.75 minutes after the timer starts. ta 35715 (a) Draw a density curve to model this distribution of random numbers. Be sure to include scales on both axes. (b) About what percent of the time will an enemy appear between 0.5 minutes and 2 minutes after the timer starts? (c) Find the 20th percentile of this distribution. AB Learning Target 2.3.2 Is it left skewed, too? Mean versus median PROBLEM: A density curve that models the distribution of a quantitative variable is shown. Identify the location of the mean and median by letter. Justify your answers. hewan way agad yun mubarb 10 Les 10 Leam - 197 con diweb eidt…arrow_forwardb. Sketch a standard normal curve and shade the area under the curve that lies between - 3 and - 2.1. Choose the correct graph below. А. В. С. OD. - 2.1 2.1 O 2.1 3 O 2.1 3 The area that lies between - 3 and - 2.1 is 0.98 (Round to four decimal places as needed.) Narrow_forwardTea Bag Weight (in grams) 5.65 5.45 5.42 5.41 5.53 5.34 5.54 5.46 5.53 5.43 5.61 5.56 5.47 5.44 5.49 5.32 5.68 5.29 5.49 5.57 5.54 5.58 5.59 5.42 5.51 5.55 5.54 5.49 5.39 5.46 5.63 5.53 5.76 5.56 5.41 5.57 5.59 5.61 5.44 5.45 5.24 5.56 5.52 5.33 5.49 5.58 5.68 5.35 5.63 5.49 narrow_forward
- An experimental diet to induce weight loss was followed for one week by a randomly selected group of 12 students with the following results. Loss in Pounds Student 1 2 3 5 6 7 8 9 10 11 12 2.5 2.9 0.4 1.7 0.0 1.5 5.5 3.5 3.9 3.5 1.1 2.9 (a) Find a point estimate for the average amount lost after one week on this diet. 2.55 ]x Is this an unbiased estimate of the population mean? Explain. Yes, this an unbiased estimate of the population mean, since E(X) = µ. Yes, this an unbiased estimate of the population mean, since E(X) + μ. O No, this is not an unbiased estimate of the population mean, since E(X) * μ. O No, this is not an unbiased estimate of the population mean, since E(X) = μ. O No, this is not an unbiased estimate of the population mean, since the sample size is too small. (b) Find a point estimate for the variance of the amount lost on this diet. (Round your answer to four decimal places.) 2.3264 x Is this an unbiased estimate of the population variance? Explain. Yes, this an…arrow_forwardIdentify claim etcarrow_forwardiew History Bookmarks Реople Tab Window Help b My Questions | bartleby W How To Delete Bartleby Accou X ure.com/courses/20952/assignments/284250 You intend to estimate a population mean u from the following sample. 71.4 56.5 57.2 57.5 48 53.6 61.7 51.3 65.5 51.4 56.8 69.8 52.7 61.6 77.3 53.6 47.8 59.6 56.4 65.4 51.2 69.9 48.4 73.5 64.9 63 62.1 60.8 48.4 55.5 50.8 63.5 40.4 71.2 71.6 56.3 62.5 57.8 64.4 51.1 72.3 58.8 69 49.8 54.3 54.2 57.8 67.8 59.9 63.5 63.4 65.9 71.1 Find the 99% confidence interval. Enter your answer as a tri-linear inequality accurate to two decimal place (because the sample data are reported accurate to one decimal place). <µ < Answer should be obtained without any preliminary rounding. However, the critical value may be rounded to 3 decimal places. Question Help: MMessage instructor Submit Question 1,454 Ост 26 étv N MacBook Airarrow_forward
- es Section Exercise 7-16 (Algo) Find the standard normal area for each of the following: (Round your answers to 4 decimal places.) P(1.23 0.52) Standard normal areaarrow_forwardK A ski gondola carries skiers to the top of a mountain. Assume that weights of skiers are normally distributed with a mean of 187 lb and a standard deviation of 40 lb. The gondola has a stated capacity of 25 passengers, and the gondola is rated for a load limit of 3500 lb. Complete parts (a) through (d) below. a. Given that the gondola is rated for a load limit of 3500 lb, what is the maximum mean weight of the passengers if the gondola is filled to the stated capacity of 25 passengers? The maximum mean weight is lb. (Type an integer or a decimal. Do not round.) b. If the gondola is filled with 25 randomly selected skiers, what is the probability that their mean weight exceeds the value from part (a)? The probability is (Round to four decimal places as needed.) c. If the weight assumptions were revised so that the new capacity became 20 passengers and the gondola is filled with 20 randomly selected skiers, what is the probability that their mean weight exceeds 175 lb, which is the…arrow_forward
arrow_back_ios
arrow_forward_ios
Recommended textbooks for you
- MATLAB: An Introduction with ApplicationsStatisticsISBN:9781119256830Author:Amos GilatPublisher:John Wiley & Sons Inc
 Probability and Statistics for Engineering and th...StatisticsISBN:9781305251809Author:Jay L. DevorePublisher:Cengage Learning
 Statistics for The Behavioral Sciences (MindTap C...StatisticsISBN:9781305504912Author:Frederick J Gravetter, Larry B. WallnauPublisher:Cengage Learning
  Elementary Statistics: Picturing the World (7th E...StatisticsISBN:9780134683416Author:Ron Larson, Betsy FarberPublisher:PEARSON
 The Basic Practice of StatisticsStatisticsISBN:9781319042578Author:David S. Moore, William I. Notz, Michael A. FlignerPublisher:W. H. Freeman
 Introduction to the Practice of StatisticsStatisticsISBN:9781319013387Author:David S. Moore, George P. McCabe, Bruce A. CraigPublisher:W. H. Freeman
MATLAB: An Introduction with Applications
Statistics
ISBN:9781119256830
Author:Amos Gilat
Publisher:John Wiley & Sons Inc
Probability and Statistics for Engineering and th...
Statistics
ISBN:9781305251809
Author:Jay L. Devore
Publisher:Cengage Learning
Statistics for The Behavioral Sciences (MindTap C...
Statistics
ISBN:9781305504912
Author:Frederick J Gravetter, Larry B. Wallnau
Publisher:Cengage Learning
Elementary Statistics: Picturing the World (7th E...
Statistics
ISBN:9780134683416
Author:Ron Larson, Betsy Farber
Publisher:PEARSON
The Basic Practice of Statistics
Statistics
ISBN:9781319042578
Author:David S. Moore, William I. Notz, Michael A. Fligner
Publisher:W. H. Freeman
Introduction to the Practice of Statistics
Statistics
ISBN:9781319013387
Author:David S. Moore, George P. McCabe, Bruce A. Craig
Publisher:W. H. Freeman