MATLAB: An Introduction with Applications
6th Edition
ISBN: 9781119256830
Author: Amos Gilat
Publisher: John Wiley & Sons Inc
expand_more
expand_more
format_list_bulleted
Question
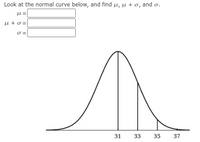
Look at the normal curve below, and find ?, ? + ?, and ?.
? =
? + ? =
? =

Transcribed Image Text:Look at the normal curve below, and find u, u + o, and o.
u + o =
31
33
35
37
||
I| ||
Expert Solution
This question has been solved!
Explore an expertly crafted, step-by-step solution for a thorough understanding of key concepts.
This is a popular solution
Trending nowThis is a popular solution!
Step by stepSolved in 2 steps with 2 images

Knowledge Booster
Similar questions
- There are two national college-entrance examinations, the scholastic aptitude test (SAT) and the American College Testing program (ACT). Scores on the SATs are approximately normal with mean 500 and standard deviation 100. Scores on the ACTs are approximately normal with mean 18 and standard deviation 6. Use the links provided for the Normal (Links to an external site.)calculator and the Inverse Normal (Links to an external site.) calculator to help complete the problems, you do not need to do any work out by hand. (instructions on how to use these calculators can be found in the week 5 star on the home page) a) What percent of all SAT scores are above 600? b) Which is the greater accomplishment, scoring 630 on the SAT or 22 on the ACT ? Explain your reasoning for your choice. c) How high a score in the SAT is needed to place in the top 2.5%.arrow_forwardWhich of the following is True about the Z-score of an observation? A. The Z-score of an observation is defined as the number of standard deviations from the mean. B. If the observation is twice as large as the mean, its Z-score is 1. C. The Z-score of an observation is a number between 0 and 1. D. If the observation is right at the mean, its Z-score is 1.arrow_forwardNEW STUDY: A researcher is interested in the relationship between levels of stress at work and self-reports of overall health. Stress at work is measured on a scale from 0 (no stress at work) to 100 (extreme levels of stress at work). The researcher conducts a study with 11 subjects and determines that the relationship between self-reports of stress and self-reports of overall heath is r = -.41. Which test was conducted for this study? Group of answer choices z-test t-test correlation chi-squarearrow_forward
- . How high are the levels for the highest (top) 4.8% of all children? Z- score = Answer =arrow_forward=CONFIDENCE.T (0.1, 3.533, 16arrow_forwardIf you recieved the data set {9, 16, 10, 20, X} and you knew the median was 15, what could you say about X? O 10 < X < 18 OX = 14 O11 < X < 17 OX = 15 ONone of the above.arrow_forward
arrow_back_ios
arrow_forward_ios
Recommended textbooks for you
 MATLAB: An Introduction with ApplicationsStatisticsISBN:9781119256830Author:Amos GilatPublisher:John Wiley & Sons Inc
 Probability and Statistics for Engineering and th...StatisticsISBN:9781305251809Author:Jay L. DevorePublisher:Cengage Learning
 Statistics for The Behavioral Sciences (MindTap C...StatisticsISBN:9781305504912Author:Frederick J Gravetter, Larry B. WallnauPublisher:Cengage Learning
 Elementary Statistics: Picturing the World (7th E...StatisticsISBN:9780134683416Author:Ron Larson, Betsy FarberPublisher:PEARSON
 The Basic Practice of StatisticsStatisticsISBN:9781319042578Author:David S. Moore, William I. Notz, Michael A. FlignerPublisher:W. H. Freeman
 Introduction to the Practice of StatisticsStatisticsISBN:9781319013387Author:David S. Moore, George P. McCabe, Bruce A. CraigPublisher:W. H. Freeman

MATLAB: An Introduction with Applications
Statistics
ISBN:9781119256830
Author:Amos Gilat
Publisher:John Wiley & Sons Inc

Probability and Statistics for Engineering and th...
Statistics
ISBN:9781305251809
Author:Jay L. Devore
Publisher:Cengage Learning

Statistics for The Behavioral Sciences (MindTap C...
Statistics
ISBN:9781305504912
Author:Frederick J Gravetter, Larry B. Wallnau
Publisher:Cengage Learning

Elementary Statistics: Picturing the World (7th E...
Statistics
ISBN:9780134683416
Author:Ron Larson, Betsy Farber
Publisher:PEARSON

The Basic Practice of Statistics
Statistics
ISBN:9781319042578
Author:David S. Moore, William I. Notz, Michael A. Fligner
Publisher:W. H. Freeman

Introduction to the Practice of Statistics
Statistics
ISBN:9781319013387
Author:David S. Moore, George P. McCabe, Bruce A. Craig
Publisher:W. H. Freeman