8. Comparing two different datasets. a. Using Excel, plot the following datasets (A, B) as two scatterplots. Download an Excel spreadsheet with the data here. Fit a linear trend line to each dataset and display the equation of the line. Copy and paste screenshots of the plots in the boxes below" B A Tree age (years) Circumference Volume of Oil Energy Combustion (centimeters). (ml) (kilojoules, kJ) 6 38 100 3,238 13 50 101 3,300 16 69 112 3,520 28 83 118 3,815 30 88 124 4,015 37 102 131 4,241 43 117 143 4,530 53 179 152 4,921 64 162 153 4,953 91 271 171 5,536 98 365 186 6,032 97 355 189 6,119 104 345 191 6,184 125 343 195 6,313 133 488 196 6,446 138 509 200 6,475 A. screenshot of scatterplot: B. screenshot of scatterplot: b. Calculate the R2 value for each of the two data sets manually in Excel following steps in Toolkit 2B. Report 2 significant figures. A. R-squared value B. R-squared value c. Do data sets A or B have notable outliers (0) (yes/no)? By how many percentage points does the R2 value decrease or increase when this/these outliers are removed? (ii) (0) (ii)
8. Comparing two different datasets. a. Using Excel, plot the following datasets (A, B) as two scatterplots. Download an Excel spreadsheet with the data here. Fit a linear trend line to each dataset and display the equation of the line. Copy and paste screenshots of the plots in the boxes below" B A Tree age (years) Circumference Volume of Oil Energy Combustion (centimeters). (ml) (kilojoules, kJ) 6 38 100 3,238 13 50 101 3,300 16 69 112 3,520 28 83 118 3,815 30 88 124 4,015 37 102 131 4,241 43 117 143 4,530 53 179 152 4,921 64 162 153 4,953 91 271 171 5,536 98 365 186 6,032 97 355 189 6,119 104 345 191 6,184 125 343 195 6,313 133 488 196 6,446 138 509 200 6,475 A. screenshot of scatterplot: B. screenshot of scatterplot: b. Calculate the R2 value for each of the two data sets manually in Excel following steps in Toolkit 2B. Report 2 significant figures. A. R-squared value B. R-squared value c. Do data sets A or B have notable outliers (0) (yes/no)? By how many percentage points does the R2 value decrease or increase when this/these outliers are removed? (ii) (0) (ii)

Fundamentals of Information Systems
9th Edition
ISBN:9781337097536
Author:Ralph Stair, George Reynolds
Publisher:Ralph Stair, George Reynolds
Chapter6: Business Intelligence And Analytics
Section: Chapter Questions
Problem 1SAT

Related questions
Question
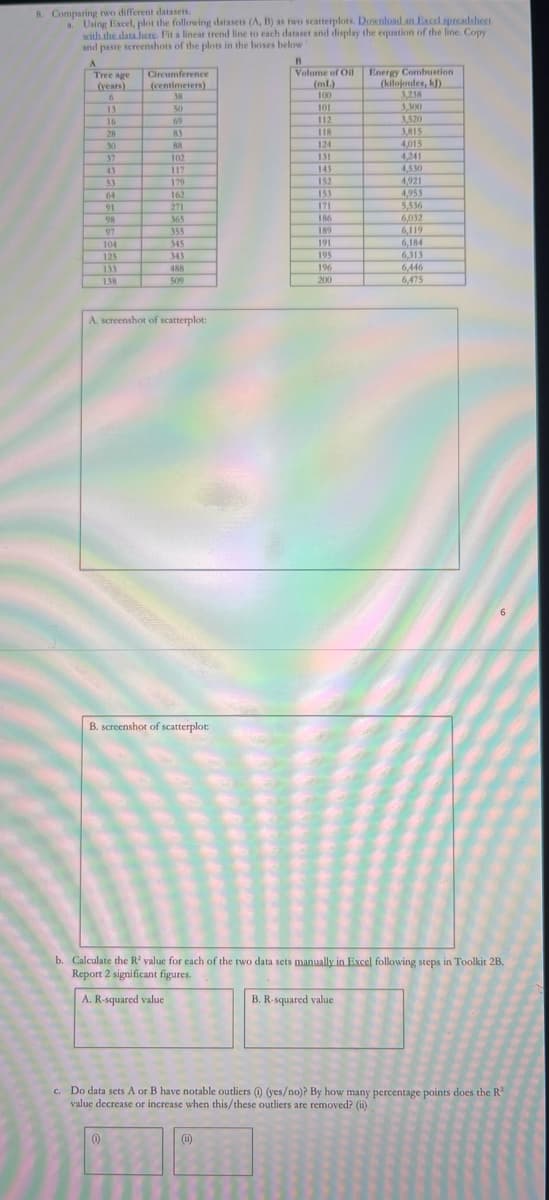
Transcribed Image Text:8. Comparing two different datasets.
a. Using Excel, plot the following datasets (A, B) as two scatterplots. Download an Excel spreadsheet
with the data here. Fit a linear trend line to each dataset and display the equation of the line. Copy
and paste screenshots of the plots in the boxes below"
B
A
Tree age
(years)
Circumference
Volume of Oil
Energy Combustion
(centimeters).
(ml)
(kilojoules, kJ)
6
38
100
3,238
13
50
101
3,300
16
69
112
3,520
28
83
118
3,815
30
88
124
4,015
37
102
131
4,241
43
117
143
4,530
53
179
152
4,921
64
162
153
4,953
91
271
171
5,536
98
365
186
6,032
97
355
189
6,119
104
345
191
6,184
125
343
195
6,313
133
488
196
6,446
138
509
200
6,475
A. screenshot of scatterplot:
B. screenshot of scatterplot:
b. Calculate the R2 value for each of the two data sets manually in Excel following steps in Toolkit 2B.
Report 2 significant figures.
A. R-squared value
B. R-squared value
c. Do data sets A or B have notable outliers (0) (yes/no)? By how many percentage points does the R2
value decrease or increase when this/these outliers are removed? (ii)
(0)
(ii)
Expert Solution
This question has been solved!
Explore an expertly crafted, step-by-step solution for a thorough understanding of key concepts.

This is a popular solution!

Trending now
This is a popular solution!

Step by step
Solved in 2 steps with 9 images

Recommended textbooks for you
Fundamentals of Information Systems
Computer Science
ISBN:
9781337097536
Author:
Ralph Stair, George Reynolds
Publisher:
Cengage Learning
Fundamentals of Information Systems
Computer Science
ISBN:
9781337097536
Author:
Ralph Stair, George Reynolds
Publisher:
Cengage Learning