
MATLAB: An Introduction with Applications
6th Edition
ISBN: 9781119256830
Author: Amos Gilat
Publisher: John Wiley & Sons Inc
expand_more
expand_more
format_list_bulleted
Related questions
Question
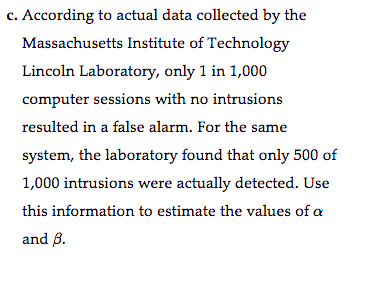

Transcribed Image Text:c. According to actual data collected by the
Massachusetts Institute of Technology
Lincoln Laboratory, only 1 in 1,000
computer sessions with no intrusions
resulted in a false alarm. For the same
system, the laboratory found that only 500 of
1,000 intrusions were actually detected. Use
this information to estimate the values of a
and B.

Transcribed Image Text:7.18 INTRUSION DETECTION SYSTEMS. The
Journal of Research of the National Institute of Standards
and Technology (November-December 2003)
published a study of a computer intrusion detection
system (IDS). The IDS is designed to provide an
alarm whenever unauthorized access (e.g., an
intrusion) to a computer system occurs. The
probability of the system giving a false alarm (i.e.,
providing a warning when no intrusion occurs) is
defined by the symbol a, while the probability of a
missed detection (i.e., no warning given when an
intrusion occurs) is defined by the symbol 3. These
symbols are used to represent Type I and Type II
error rates, respectively, in a hypothesis-testing
scenario.
a. What is the null hypothesis, Ho?
b. What is the alternative hypothesis, Ha?
Expert Solution
This question has been solved!
Explore an expertly crafted, step-by-step solution for a thorough understanding of key concepts.

This is a popular solution

Trending nowThis is a popular solution!

Step by stepSolved in 3 steps with 3 images

Knowledge Booster

Similar questions
- Selecting the Appropriate Inferential Test: For each of the studies below, please identify the following (or indicate N/A "not applicable" if the feature is not relevant to the design): a) Independent Variable(s) (IVs) and # of levels for any IVs (for Correlation/Regression, identify the predictor and predicted variable rather than IV and DV) b) Dependent Variable (DV) c) Scale of Measurement for the Dependent Variable: (Nominal, Ordinal, Interval, Ratio) for Correlation/Regression please make sure you identify the scale of measurement for both variables d) Appropriate Statistical Test (If it is a Factorial ANOVA, make sure to name the design: e.g., 2 X 2, 2 X 3, etc.)arrow_forwardWhen LeBron James shoots a free throw, he hits with a probability of 0.9 and misses with a probability of 0.1. Assume that the result of his previous free throw (whether a hit or a miss), does not affect the probability with which he hits the current throw, i.e., for any free throw he shoots, he hits with a probability of 0.9 and misses with a probability of 0.1. When he hits a free throw, he makes one point and when he misses a free throw, he makes zero points. Answer the following questions with this information. Let P1 denote a random variable that represents the number of points LeBron James makes when he shoots only one free throw. 1. How many possible values can P1 take? Develop a probability distribution for P1 (Very important: Enter the values of P1 in increasing order as you go down in the table) P1 f(P1) (1 decimal) (1 decimal)arrow_forwardSection F: In a random sample of 150 unemployed males, 81 of them stated that they were regular consumers of alcoholic beverages. Let p denote the true proportion of unemployed males that are regular consumers of alcoholic beverages.arrow_forward
- Section F: In a random sample of 150 unemployed males, 81 of them stated that they were regular consumers of alcoholic beverages. Let p denote the true proportion of unemployed males that are regular consumers of alcoholic beverages.arrow_forwardRole-playing games like Dungeons & Dragons use many different types of dice. Suppose that a four-sided die has faces marked 1, 2, 3, and 4. The intelligence of a character is determined by rolling this die twice and adding 1 to the sum of the spots. The faces are equally likely, and the two rolls are independent. What is the average (mean) intelligence for such characters?arrow_forward4) Consider the following table of data that shows the results of asking a group of people about yearly income: $20,000 – 29,999 $30,000 - 39,999 $40,000 - 49,999 Totals Male 49 80 127 256 Female 47 97 93 237 Totals 96 177 220 493 i) Determine the probability that one randomly selected person from the group is a female that earns between $30,000 and $39,999arrow_forward
- 2. Use the table below, based on the most recent survey of moviegoers who viewed movie Joker, to answer the following questions. (The cell values are frequencies). Rating Fantastic Very good OK Pretty bad Awful Male 34 18 47 14 17 Gender Female 27 19 44 12 26 a) Determine the probability a moviegoer selected at random rated Joker as "Very good" or better (L.e., "Very good" or "Fantastic"). b) Determine the probability a Female moviegoer selected at random rated Joker as "Very good" or better (meaning "Very good" or "Fantastic"). c) Given your answers to Parts a), b), and c), are the two variables - Joker ratings and Gender-statistically independent?arrow_forward2) A+udy is made which compares gender with smoking habits. Here are the results: Male Female Non Smoker Light Smoker 60 Heavy Smoker 250 310 70 70 40 Find these probabilities: a) P (Female / Light Smoker) b) P (Light Smoker/ Female) c) P(Male / Smoker) d) P (Male / Female) e) Are gender and smoking habits independent? Explain your answer briefly. Focus 83 12/1arrow_forward
arrow_back_ios
arrow_forward_ios
Recommended textbooks for you
- MATLAB: An Introduction with ApplicationsStatisticsISBN:9781119256830Author:Amos GilatPublisher:John Wiley & Sons Inc
 Probability and Statistics for Engineering and th...StatisticsISBN:9781305251809Author:Jay L. DevorePublisher:Cengage Learning
 Statistics for The Behavioral Sciences (MindTap C...StatisticsISBN:9781305504912Author:Frederick J Gravetter, Larry B. WallnauPublisher:Cengage Learning
  Elementary Statistics: Picturing the World (7th E...StatisticsISBN:9780134683416Author:Ron Larson, Betsy FarberPublisher:PEARSON
 The Basic Practice of StatisticsStatisticsISBN:9781319042578Author:David S. Moore, William I. Notz, Michael A. FlignerPublisher:W. H. Freeman
 Introduction to the Practice of StatisticsStatisticsISBN:9781319013387Author:David S. Moore, George P. McCabe, Bruce A. CraigPublisher:W. H. Freeman
MATLAB: An Introduction with Applications
Statistics
ISBN:9781119256830
Author:Amos Gilat
Publisher:John Wiley & Sons Inc
Probability and Statistics for Engineering and th...
Statistics
ISBN:9781305251809
Author:Jay L. Devore
Publisher:Cengage Learning
Statistics for The Behavioral Sciences (MindTap C...
Statistics
ISBN:9781305504912
Author:Frederick J Gravetter, Larry B. Wallnau
Publisher:Cengage Learning
Elementary Statistics: Picturing the World (7th E...
Statistics
ISBN:9780134683416
Author:Ron Larson, Betsy Farber
Publisher:PEARSON
The Basic Practice of Statistics
Statistics
ISBN:9781319042578
Author:David S. Moore, William I. Notz, Michael A. Fligner
Publisher:W. H. Freeman
Introduction to the Practice of Statistics
Statistics
ISBN:9781319013387
Author:David S. Moore, George P. McCabe, Bruce A. Craig
Publisher:W. H. Freeman