The following graph plots equilibrium in the money market at an interest rate of 1.5% and a quantity of money equal to $15 billion. Show the impact of the increase in government purchases on the interest rate by shifting one or both of the curves on the following graph. INTEREST RATE 3.0 Money Supply 25 Money Demand 2.0 1.5 1.0 0.5 0 0 5 10 15 Money Demand 20 25 30 MONEY (Billions of dollars) Money Supply Suppose that for every increase in the interest rate of one percentage point, the level of investment spending declines by $1 billion. Based on the changes made to the money market in the previous scenario, the new interest rate causes the level of investment spending to ▼ by Taking the multiplier effect into account, the change in investment spending will cause the quantity of output demanded to known as the by at every price level. The impact of an increase in government purchases on the interest rate and the level of investment spending is effect. Use the purple line (diamond symbol) on the graph at the beginning of this problem to show the aggregate demand curve (AD) after accounting for the impact of the increase in government purchases on the interest rate and the level of investment spending. Hint: Be sure your final aggregate demand curve (AD3) is parallel to AD₁ and AD2. You can see the slopes of AD and AD₂ by selecting them on the graph. 7. Fiscal policy, the money market, and aggregate demand Suppose there is some hypothetical economy in which households spend $0.50 of each additional dollar they earn and save the $0.50 they have left over. The following graph plots the economy's initial aggregate demand curve (ADI). Suppose now that the government increases its purchases by $2.5 billion. Use the green line (triangle symbol) on the following graph to show the aggregate demand curve (AD) after the multiplier effect takes place. Hint: Be sure the new aggregate demand curve (AD₂) is parallel to AD₁. You can see the slope of AD₁ by selecting it on the following graph. PRICE LEVEL 116 114 112 10 110 108 106 104 102 AD₂ AD AD3 100 100 102 104 106 108 110 112 114 116 OUTPUT (Billions of dollars)
The following graph plots equilibrium in the money market at an interest rate of 1.5% and a quantity of money equal to $15 billion. Show the impact of the increase in government purchases on the interest rate by shifting one or both of the curves on the following graph. INTEREST RATE 3.0 Money Supply 25 Money Demand 2.0 1.5 1.0 0.5 0 0 5 10 15 Money Demand 20 25 30 MONEY (Billions of dollars) Money Supply Suppose that for every increase in the interest rate of one percentage point, the level of investment spending declines by $1 billion. Based on the changes made to the money market in the previous scenario, the new interest rate causes the level of investment spending to ▼ by Taking the multiplier effect into account, the change in investment spending will cause the quantity of output demanded to known as the by at every price level. The impact of an increase in government purchases on the interest rate and the level of investment spending is effect. Use the purple line (diamond symbol) on the graph at the beginning of this problem to show the aggregate demand curve (AD) after accounting for the impact of the increase in government purchases on the interest rate and the level of investment spending. Hint: Be sure your final aggregate demand curve (AD3) is parallel to AD₁ and AD2. You can see the slopes of AD and AD₂ by selecting them on the graph. 7. Fiscal policy, the money market, and aggregate demand Suppose there is some hypothetical economy in which households spend $0.50 of each additional dollar they earn and save the $0.50 they have left over. The following graph plots the economy's initial aggregate demand curve (ADI). Suppose now that the government increases its purchases by $2.5 billion. Use the green line (triangle symbol) on the following graph to show the aggregate demand curve (AD) after the multiplier effect takes place. Hint: Be sure the new aggregate demand curve (AD₂) is parallel to AD₁. You can see the slope of AD₁ by selecting it on the following graph. PRICE LEVEL 116 114 112 10 110 108 106 104 102 AD₂ AD AD3 100 100 102 104 106 108 110 112 114 116 OUTPUT (Billions of dollars)

Chapter11: Fiscal Policy
Section: Chapter Questions
Problem 1.8P

Related questions
Question
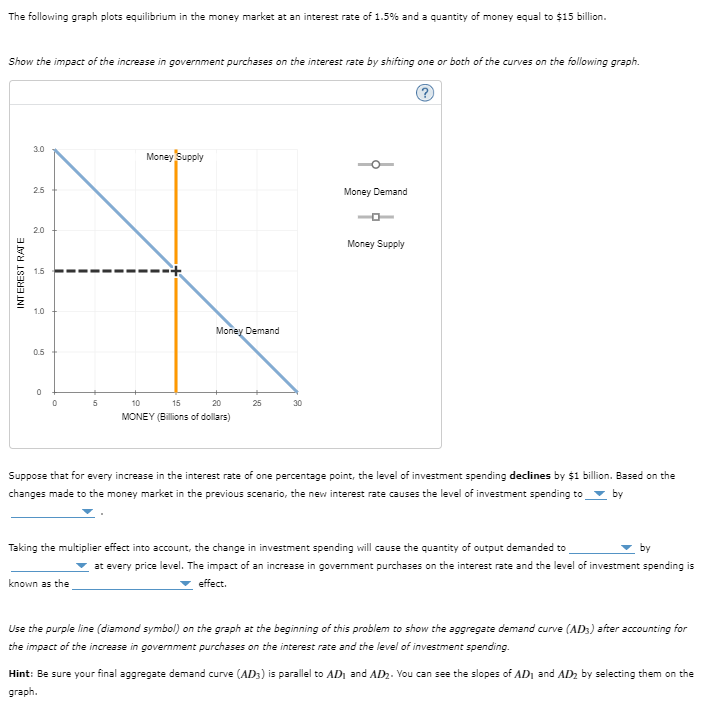
Transcribed Image Text:The following graph plots equilibrium in the money market at an interest rate of 1.5% and a quantity of money equal to $15 billion.
Show the impact of the increase in government purchases on the interest rate by shifting one or both of the curves on the following graph.
INTEREST RATE
3.0
Money Supply
25
Money Demand
2.0
1.5
1.0
0.5
0
0
5
10
15
Money Demand
20
25
30
MONEY (Billions of dollars)
Money Supply
Suppose that for every increase in the interest rate of one percentage point, the level of investment spending declines by $1 billion. Based on the
changes made to the money market in the previous scenario, the new interest rate causes the level of investment spending to ▼ by
Taking the multiplier effect into account, the change in investment spending will cause the quantity of output demanded to
known as the
by
at every price level. The impact of an increase in government purchases on the interest rate and the level of investment spending is
effect.
Use the purple line (diamond symbol) on the graph at the beginning of this problem to show the aggregate demand curve (AD) after accounting for
the impact of the increase in government purchases on the interest rate and the level of investment spending.
Hint: Be sure your final aggregate demand curve (AD3) is parallel to AD₁ and AD2. You can see the slopes of AD and AD₂ by selecting them on the
graph.
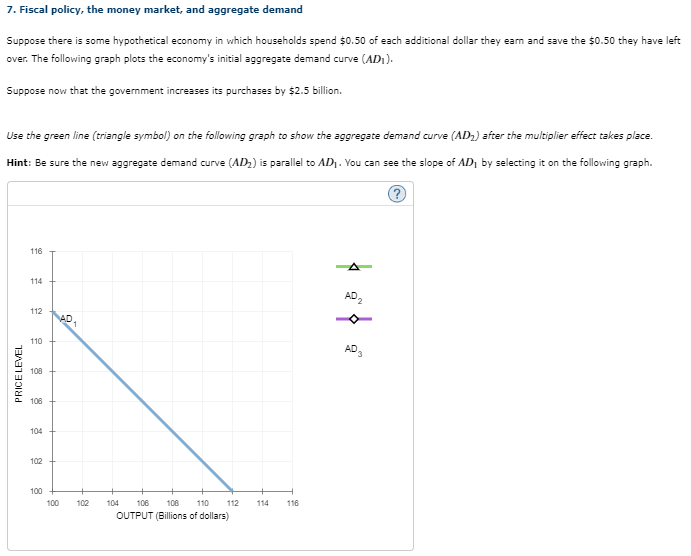
Transcribed Image Text:7. Fiscal policy, the money market, and aggregate demand
Suppose there is some hypothetical economy in which households spend $0.50 of each additional dollar they earn and save the $0.50 they have left
over. The following graph plots the economy's initial aggregate demand curve (ADI).
Suppose now that the government increases its purchases by $2.5 billion.
Use the green line (triangle symbol) on the following graph to show the aggregate demand curve (AD) after the multiplier effect takes place.
Hint: Be sure the new aggregate demand curve (AD₂) is parallel to AD₁. You can see the slope of AD₁ by selecting it on the following graph.
PRICE LEVEL
116
114
112
10
110
108
106
104
102
AD₂
AD
AD3
100
100 102
104 106 108 110
112
114
116
OUTPUT (Billions of dollars)
Expert Solution
This question has been solved!
Explore an expertly crafted, step-by-step solution for a thorough understanding of key concepts.

This is a popular solution!

Trending now
This is a popular solution!

Step by step
Solved in 2 steps

Recommended textbooks for you

Principles of Economics 2e
Economics
ISBN:
9781947172364
Author:
Steven A. Greenlaw; David Shapiro
Publisher:
OpenStax

Brief Principles of Macroeconomics (MindTap Cours…
Economics
ISBN:
9781337091985
Author:
N. Gregory Mankiw
Publisher:
Cengage Learning
Principles of Economics 2e
Economics
ISBN:
9781947172364
Author:
Steven A. Greenlaw; David Shapiro
Publisher:
OpenStax
Brief Principles of Macroeconomics (MindTap Cours…
Economics
ISBN:
9781337091985
Author:
N. Gregory Mankiw
Publisher:
Cengage Learning

Essentials of Economics (MindTap Course List)
Economics
ISBN:
9781337091992
Author:
N. Gregory Mankiw
Publisher:
Cengage Learning


Economics (MindTap Course List)
Economics
ISBN:
9781337617383
Author:
Roger A. Arnold
Publisher:
Cengage Learning