
Elementary Geometry For College Students, 7e
7th Edition
ISBN: 9781337614085
Author: Alexander, Daniel C.; Koeberlein, Geralyn M.
Publisher: Cengage,
expand_more
expand_more
format_list_bulleted
Related questions
Concept explainers
Topic Video
Question
Properties of midsegments
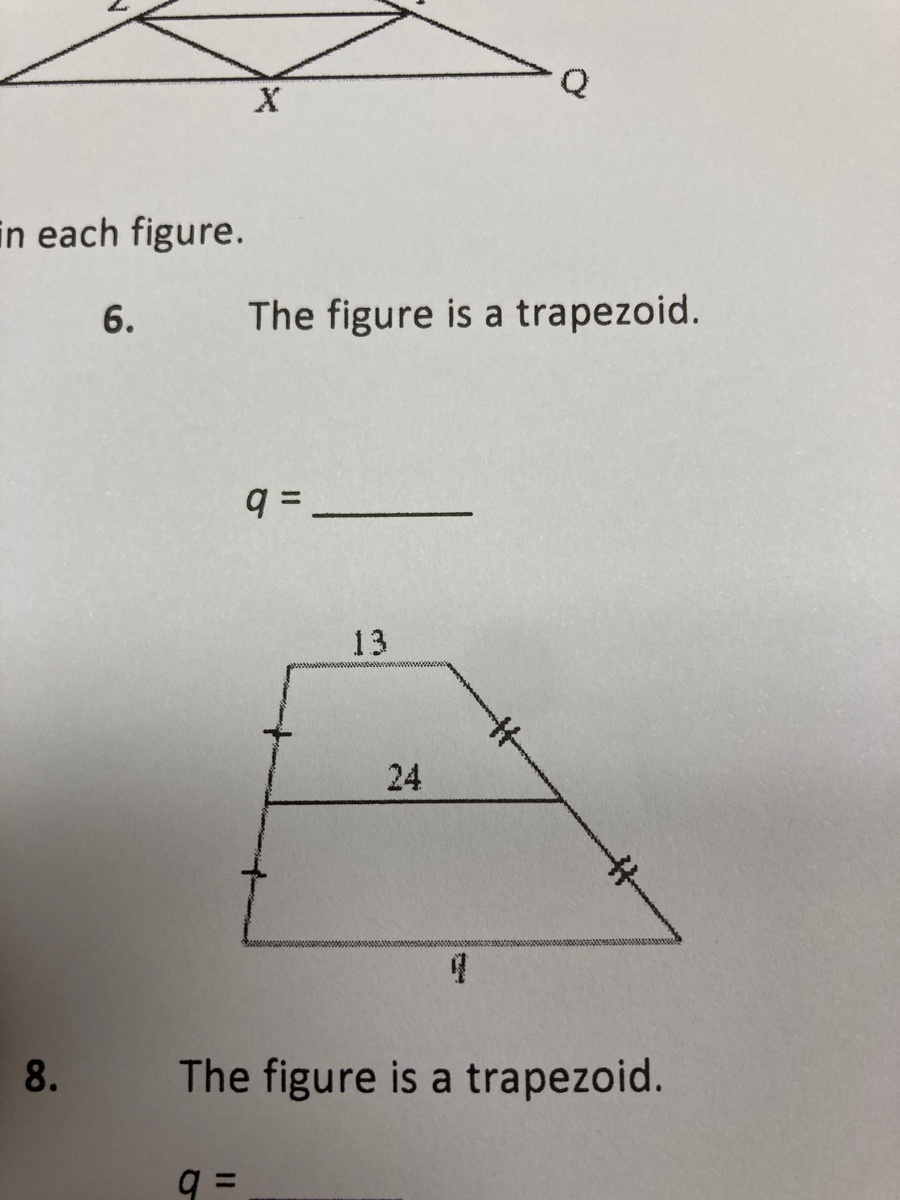

Transcribed Image Text:in each figure.
6.
The figure is a trapezoid.
13
24
The figure is a trapezoid.
q =
8.

Transcribed Image Text:1. a =
2. x =
3. x =
y
C =
z =
14
16
29
13
54°
37°
21
4. X, Y, and Z are midpoints. Perimeter APQR
132, RQ = 55, and PZ = 20.
Perimeter AXYZ
Z
PQ =
%3D
ZX
or Problems 5-8, find the lettered measures in each figure.
6.
The figure is a trapezoid.
y =
Expert Solution
This question has been solved!
Explore an expertly crafted, step-by-step solution for a thorough understanding of key concepts.

This is a popular solution

Trending nowThis is a popular solution!

Step by stepSolved in 2 steps

Knowledge Booster


Learn more about
Need a deep-dive on the concept behind this application? Look no further. Learn more about this topic, geometry and related others by exploring similar questions and additional content below.Similar questions
- Distribution of Proportions Each week, Nielsen Media Research conducts a survey of 5000 households and records the proportion of households tuned to 60 Minutes. If we obtain a large collection of those proportions and construct a histogram of them, what is the approximate shape of the histogram?arrow_forwardDataset 1: 3, 5, 6, 7, 9 The IQR of dataset 1 from ___ to ___. I understand that IQR= Q3-Q1, I'm just not sure I am doing it correctly.arrow_forwardStatistics review questionarrow_forward
- Relative Strength Relative Strength Percentage Last Week This Week of Weeks Stocks stronger Stocks stronger 80 Bonds stronger 10 Equally Strong 10 Bonds stronger Stocks stronger 20 Bonds stronger 60 Equally Strong 20 Egually Strong Steokoarrow_forwardFish Counts / Acre Acid Rain and Aquatic Life 125 100 75- 50 25 4.0 4.5 5.0 5.5 6.0 6.5 pH of Lake Water The scatterplot above shows fish counts per acre in a number of lakes in Eastern Canada, where acid rain has been a known problem for several decades. The pH (a measure of acidity) of the water in each lake was also measured.arrow_forwardWalmart Revenue The annual revenue of Walmart is given in the table below (source ). Walmart Annual Revenue (Billions of US dollars) 559.151 Year 2021 2020 2019 2018 2017 2016 2015 2014 2013 2012 2011 2010 2009 2008 2007 2006 2005 523.964 514.405 500.343 485.873 482.130 485.651 476.294 468.651 446.509 421.849 408.085 404.254 377.023 348.368 312.101 284.310 Apply linear regression to the data in the table to find a model y = mx + b, where y is Walmart's annual revenue in billions of US dollars, and a is the number of years since 2000. Use the model y = mx + b with m rounded to the nearest tenth and 6 rounded to the nearestarrow_forward
- Earnings class Frequency Relative Frequency Cumulative Relative Frequency $0 ≤ Bill < $60 99 0.5294 0.5294 $60 ≤ Bill < $120 79 0.4225 0.9519 $120 ≤ Bill < $180 3 0.0160 0.9679 $180 ≤ Bill < $240 2 0.0107 0.9786 $240 ≤ Bill < $300 0 0.0000 0.9786 $300 ≤ Bill 4 0.0214 1 Construct a relative frequency histogram and an ogive for the bill data of male students, using the frequency distribution tablearrow_forwardRelative Frequency 0.40 0.35 0.30 0.25 0.20 0.15 0.10 0.05 0.00 0.00 Mature 0.00 0.00 0.00 Teen Everyone Everyone 10+arrow_forwardPls help ASAP on both pls I BEGarrow_forward
arrow_back_ios
arrow_forward_ios
Recommended textbooks for you
- Elementary Geometry For College Students, 7eGeometryISBN:9781337614085Author:Alexander, Daniel C.; Koeberlein, Geralyn M.Publisher:Cengage,
 Elementary Geometry for College StudentsGeometryISBN:9781285195698Author:Daniel C. Alexander, Geralyn M. KoeberleinPublisher:Cengage Learning
Elementary Geometry For College Students, 7e
Geometry
ISBN:9781337614085
Author:Alexander, Daniel C.; Koeberlein, Geralyn M.
Publisher:Cengage,
Elementary Geometry for College Students
Geometry
ISBN:9781285195698
Author:Daniel C. Alexander, Geralyn M. Koeberlein
Publisher:Cengage Learning