MATLAB: An Introduction with Applications
6th Edition
ISBN: 9781119256830
Author: Amos Gilat
Publisher: John Wiley & Sons Inc
expand_more
expand_more
format_list_bulleted
Question

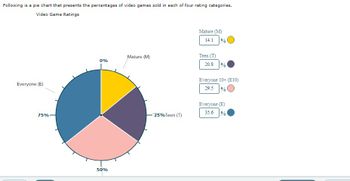
Transcribed Image Text:**Video Game Ratings Distribution**
*Following is a pie chart that presents the percentages of video games sold in each of four rating categories.*
**Video Game Ratings**
The pie chart displays the distribution of video games sold according to their rating categories.
- The entire pie chart is divided into four segments, each representing a different rating category.
- The categories and their respective percentages are color-coded for clarity.
**Explanation of Pie Chart Segments:**
1. **Everyone (E) - 35.6%:**
- Represented by a blue segment.
- This category takes up the largest portion of the pie chart.
2. **Everyone 10+ (E10) - 29.5%:**
- Represented by a peach pink segment.
- This category is the second largest.
3. **Teen (T) - 20.8%:**
- Represented by a purple segment.
- This category covers the third largest portion.
4. **Mature (M) - 14.1%:**
- Represented by a yellow segment.
- This category occupies the smallest portion of the pie chart.
By visualizing the data in a pie chart, it becomes clear that the most video games sold fall under the "Everyone (E)" category, while the "Mature (M)" category has the least sales. This indicates a trend towards video games rated for a broad audience.
The percentages ensure clarity on the proportions, making it easier to understand the distribution dynamics within the video game market based on rating categories.

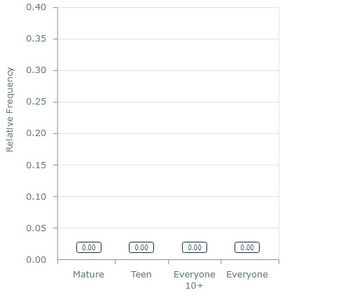
Transcribed Image Text:### Analysis of Video Game Ratings
This bar graph depicts the relative frequency of video games categorized under different rating classifications: "Mature," "Teen," "Everyone 10+," and "Everyone."
#### Key Elements of the Graph:
1. **Y-Axis (Vertical Axis):**
- Labeled as "Relative Frequency."
- The scale ranges from 0.00 to 0.40.
2. **X-Axis (Horizontal Axis):**
- Represents different video game ratings:
- **Mature**
- **Teen**
- **Everyone 10+**
- **Everyone**
3. **Data Points:**
- Each bar corresponds to the relative frequency of video games within each rating category.
- All reported relative frequencies are 0.00, representing no significant distribution of video games into these specific ratings within the presented data set.
This graph is essential in understanding the distribution (or lack thereof) of video games across these rating categories. Users can infer that there may be no substantial representation of video games classified under the ratings included in this particular study or dataset. Further analysis with a larger and more varied dataset might be required to provide more comprehensive insights.
Expert Solution
This question has been solved!
Explore an expertly crafted, step-by-step solution for a thorough understanding of key concepts.
This is a popular solution
Trending nowThis is a popular solution!
Step by stepSolved in 2 steps with 2 images

Knowledge Booster
Similar questions
- Approximately 21% of music lovers like Country Music. Of those who do, 97% do not have mild brain damage.What percent of music lovers like Country and have Brain Damage?arrow_forwardApproximately 29% of music lovers like Country Music. Of those who do, 96% do not have mild brain damage. What percent of music lovers like Country and do not have Brain Damage?arrow_forwardA recent report stated that in 1990, there were approximately 9.7 million employment opportunities in a Science, Technology, Engineering or Mathematics (STEM) related field. There is a reported 17.3 million positions available in a STEM related field in 2019. What is the relative change in the number of STEM positions available from 1990 to 2019? A. 7.6% B. 56.1% C. 43.9% D. 78.4%arrow_forward
- Virginia polled a large sample of individuals to find the percentage of students with known food allergies and the percentage of students without known food allergies. Which of the following could sufficiently display the data if only the two given categories are to be included? Select the correct answer below: bar graph pie chart either a pie chart or a bar graph neither a pie chart nor a bar grapharrow_forwardfor the dataset c(1,2,2,2,4,5,6,6,7,8,9,9), what is the 75% or .75 quantile?arrow_forwardA guide for a "Pirates of the Caribbean" role-playing game lists the following percentages for the rarity items the players may collect when a "loot box" is opened. | Item rarity |Percentage Super rare 5% Rare 10% Uncommon 25% Common 60% Sarah thinks that the guide is wrong. To test her suspicions, she opens 80| loot boxes. Her results are shown in the table below Item rarity Frequency Super rare 3 Rare 4 Uncommon 24 Common 49 Total 80 a) Calculate the expected frequency for each item. b) How many degrees of freedom are there in this test? c) Conduct a Chi-Squared test with a 1% level of significance to determine whether Sarah's suspicions are justified. USE A CRITICAL VALUE to make your decisionarrow_forward
- The data set shows the GDP per people in 24 countries, along with the proportion of person that have a linkedin social media account. A. the covariance is ___ percentage dollars. be careful of the units. round to the nearest integer. B. r= ___ c. Choose the correct answer below. A. There is no clear relationship between the GDP and LinkedIn accounts. B. There is a strong positive relationship between the GDP and LinkedIn accounts. C. There is a weak positive relationship between the GDP and LinkedIn accounts. D. There is a strong negative relationship between the GDP and LinkedIn accounts. GDP (PPP) Social Media Usage (%) 6,905 89 17,863 87 5,114 86 9,989 86 6,121 83 6,593 83 13,899 81 4,013 83 16,146 75 4,696 79 16,470 76 19,857 72 18,155 71 3,501 74 19,526 75 8,007 76 4,033 73 13,651 69 16,990 68 6,642 70 6,447 70 6,434 68 13,052 64 10,874 47arrow_forwardThe following are the GPAs of 18 r/s SCC students:1.3, 1.5, 1.7, 2.2, 2.5, 2.6, 2.6, 2.6, 2.6, 2.8, 2.9, 2.9, 3.0, 3.1, 3.5, 3.5, 3.6, 3.9(a) Find the 70th percentile of the data.(b) Find the median and Q1and Q3Make sure you properly justify how to find them.(c)Find all outliers using the IQR method d) Draw the box plot of this dataarrow_forwardApproximately 19% of music lovers like Country Music. Of those who do, 97% do not have mild brain damage.What percent of music lovers like Country and do not have Brain Damage?arrow_forward
- The table to the right shows data found at a government census website, under a "Did You Know" panel. What type of data source is the information presented here based on? Private Sector Total Employment in a State All 2008 Q2 2009 Q2 Change Female 537,290 517,948 −3.6% Male 504,214 477,491 −5.3% Retail Trade Female 168,942 146,473 −13.3% Male 162,502 144,302 −11.2% Question content area bottom Part 1 Choose the correct answer below. A. The information is the outcome of an experiment that was conducted. B. The information is the result of an observational study that was conducted. C. The information is the result of a survey that was conducted. D. The information is collected via ongoing business activities. E. The information is distributed by an organization or individual.arrow_forwardThe labels on boxes of Cheesy Poofs say that the box contains 16 ounces of Cheesy Poofs, but that doesn’t guarantee that each box contains exactly 16.00 ounces. The machine that fills the boxes doesn’t always put out the exact same amount. The amount in each box is Normally distributed, and has a standard deviation is .40 ounces. To help assure that most boxes contain as much or more than the label says, the machine is set so that the mean will be 16.28 ounces. What proportion of the boxes contain… g) Half of the boxes of Cheesy Poofs produced which are labeled 16 ounces, actually contain more than ____________________ounces. h) 14% of the boxes of Cheesy Poofs produced which are labeled 16 ounces, actually contain more than ____________________ounces.arrow_forward
arrow_back_ios
arrow_forward_ios
Recommended textbooks for you
 MATLAB: An Introduction with ApplicationsStatisticsISBN:9781119256830Author:Amos GilatPublisher:John Wiley & Sons Inc
 Probability and Statistics for Engineering and th...StatisticsISBN:9781305251809Author:Jay L. DevorePublisher:Cengage Learning
 Statistics for The Behavioral Sciences (MindTap C...StatisticsISBN:9781305504912Author:Frederick J Gravetter, Larry B. WallnauPublisher:Cengage Learning
 Elementary Statistics: Picturing the World (7th E...StatisticsISBN:9780134683416Author:Ron Larson, Betsy FarberPublisher:PEARSON
 The Basic Practice of StatisticsStatisticsISBN:9781319042578Author:David S. Moore, William I. Notz, Michael A. FlignerPublisher:W. H. Freeman
 Introduction to the Practice of StatisticsStatisticsISBN:9781319013387Author:David S. Moore, George P. McCabe, Bruce A. CraigPublisher:W. H. Freeman

MATLAB: An Introduction with Applications
Statistics
ISBN:9781119256830
Author:Amos Gilat
Publisher:John Wiley & Sons Inc

Probability and Statistics for Engineering and th...
Statistics
ISBN:9781305251809
Author:Jay L. Devore
Publisher:Cengage Learning

Statistics for The Behavioral Sciences (MindTap C...
Statistics
ISBN:9781305504912
Author:Frederick J Gravetter, Larry B. Wallnau
Publisher:Cengage Learning

Elementary Statistics: Picturing the World (7th E...
Statistics
ISBN:9780134683416
Author:Ron Larson, Betsy Farber
Publisher:PEARSON

The Basic Practice of Statistics
Statistics
ISBN:9781319042578
Author:David S. Moore, William I. Notz, Michael A. Fligner
Publisher:W. H. Freeman

Introduction to the Practice of Statistics
Statistics
ISBN:9781319013387
Author:David S. Moore, George P. McCabe, Bruce A. Craig
Publisher:W. H. Freeman