
ENGR.ECONOMIC ANALYSIS
14th Edition
ISBN: 9780190931919
Author: NEWNAN
Publisher: Oxford University Press
expand_more
expand_more
format_list_bulleted
Related questions
Question
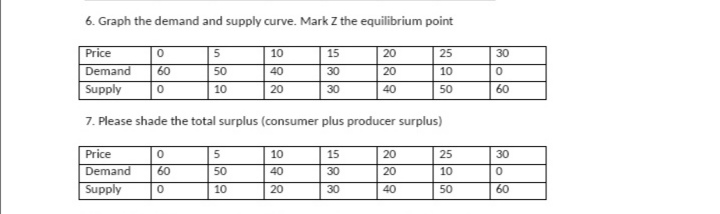

Transcribed Image Text:6. Graph the demand and supply curve. Mark Z the equilibrium point
Price
10
15
20
25
30
Demand
60
50
40
30
20
10
Supply
10
20
30
40
50
60
7. Please shade the total surplus (consumer plus producer surplus)
Price
5
10
15
20
25
30
Demand
60
50
40
30
20
10
Supply
10
20
30
40
50
60
Expert Solution
This question has been solved!
Explore an expertly crafted, step-by-step solution for a thorough understanding of key concepts.

This is a popular solution

Trending nowThis is a popular solution!

Step by stepSolved in 3 steps with 1 images

Knowledge Booster


Learn more about
Need a deep-dive on the concept behind this application? Look no further. Learn more about this topic, economics and related others by exploring similar questions and additional content below.Similar questions
- Price 27.5 CHOKRESE DEDELS 85 80 75 70 65 60 55 50 45 40 35 30 25 20 15 10 5 Supply Demand 5 10 15 20 25 30 35 40 45 50 55 60 65 70 Quantity Refer to the figure. When the price falls from $45 to $35, consumer surplus increases by $100 from new consumers entering the market. O increases by $50 from new consumers entering the market. increases by $50 from consumers who were already buying the good now paying a lower price. decreases by $50 from consumers who were already buying the good now paying a lower price.arrow_forward7. Total economic surplus The following diagram shows supply and demand in the market for laptops. Use the black point (plus symbol) to indicate the equilibrium price and quantity of laptops. Then use the green point (triangle symbol) to fill the area representing consumer surplus, and use the purple point (diamond symbol) to fill the area representing producer surplus. PRICE (Dollars per laptop) 250 225 200 175 150 125 100 75 50 25 0 0 Demand Supply 35 70 105 140 175 210 245 280 315 350 QUANTITY (Millions of laptops) Total surplus in this market is $ million. + Equilibrium A Consumer Surplus Producer Surplus (?)arrow_forwardOnly Typing answer I need ASAP Please do it ASAParrow_forward
- I need help figuring this one out?arrow_forwardquestion attached!arrow_forward16. The graph shows the market for sandwiches, and the consumer surplus and producer surplus. 18.00- Price (dollars per sandwich) What is total surplus? Total surplus is $ If the quantity demanded of sandwiches decreases by 120 an hour at each price, the demand curve shifts leftward from Do to D₁. Draw a point at the new equilibrium price and equilibrium quantity. Draw a shape to show the new producer surplus and label it PS. Draw a shape to show the new consumer surplus and label it CS. By how much does total surplus change when demand decreases? 16.00 14.00- 12.00- 10.00- 8.00- 6.00- 4.00- 2.00- Total surplus (1) by $ S D 0.00 0 30 60 90 120 150 180 210 240 270 Quantity (sandwiches per hour) Price (dollars per sandwich) 18.00- 16.00- S 14.00- 12.00- 10.00- 8.00- 6.00- 4.00- 2.00- D₁ Do 0.00 0 30 60 90 120 150 180 210 240 270 Quantity (sandwiches per hour)arrow_forward
- Solve this question correctly now. Not copy paste Anything from anywherearrow_forwardRefer to the figure. Price (dollars) 600 550 500 450 400 350 300 250 200 150 100 50 0 Market for Game Consoles D 10 20 30 40 50 60 70 80 90 100110 S Quantity Quantity, Tools ps The graph represents the weekly demand and supply for the game console market. Instructions: Enter your answers as a whole number. a. What is the equilibrium price and quantity? Price: $ game consoles b. Show the area of producer surplus on the graph, and then determine how much producer surplus is generated in the market each Instructions: Use the tool provided "PS to illustrate this area on the graph Producer Gurplus. $arrow_forward3. Demand and supply of cigarettes in California are: Supply: Qs = 2Ps + 20 Demand: QD = 200 – PD Calculate the market equilibrium price and quantity, assuming perfect competition. a. b. California decides to tax on cigarettes to fund preschool. It recognizes that a secondary benefit of the tax would be to reduce teen smoking. Suppose taxes of $15 per carton are placed on the consumption of cigarettes. By how much will the tax increase the price consumers pay? By how much will it decrease the price producers receive?arrow_forward
arrow_back_ios
SEE MORE QUESTIONS
arrow_forward_ios
Recommended textbooks for you
 Principles of Economics (12th Edition)EconomicsISBN:9780134078779Author:Karl E. Case, Ray C. Fair, Sharon E. OsterPublisher:PEARSON
 Engineering Economy (17th Edition)EconomicsISBN:9780134870069Author:William G. Sullivan, Elin M. Wicks, C. Patrick KoellingPublisher:PEARSON
 Principles of Economics (MindTap Course List)EconomicsISBN:9781305585126Author:N. Gregory MankiwPublisher:Cengage Learning
 Managerial Economics: A Problem Solving ApproachEconomicsISBN:9781337106665Author:Luke M. Froeb, Brian T. McCann, Michael R. Ward, Mike ShorPublisher:Cengage Learning
 Managerial Economics & Business Strategy (Mcgraw-...EconomicsISBN:9781259290619Author:Michael Baye, Jeff PrincePublisher:McGraw-Hill Education
Principles of Economics (12th Edition)
Economics
ISBN:9780134078779
Author:Karl E. Case, Ray C. Fair, Sharon E. Oster
Publisher:PEARSON
Engineering Economy (17th Edition)
Economics
ISBN:9780134870069
Author:William G. Sullivan, Elin M. Wicks, C. Patrick Koelling
Publisher:PEARSON
Principles of Economics (MindTap Course List)
Economics
ISBN:9781305585126
Author:N. Gregory Mankiw
Publisher:Cengage Learning
Managerial Economics: A Problem Solving Approach
Economics
ISBN:9781337106665
Author:Luke M. Froeb, Brian T. McCann, Michael R. Ward, Mike Shor
Publisher:Cengage Learning
Managerial Economics & Business Strategy (Mcgraw-...
Economics
ISBN:9781259290619
Author:Michael Baye, Jeff Prince
Publisher:McGraw-Hill Education