
MATLAB: An Introduction with Applications
6th Edition
ISBN: 9781119256830
Author: Amos Gilat
Publisher: John Wiley & Sons Inc
expand_more
expand_more
format_list_bulleted
Related questions
Question
This review problem has me stuck. I know I'm doing a "paired differences" test but I'm not completely sure what that implies. I feel like it's some sort of hypothesis test, but it's not something I remember covering in class. A bit of assistance would be fantastic!
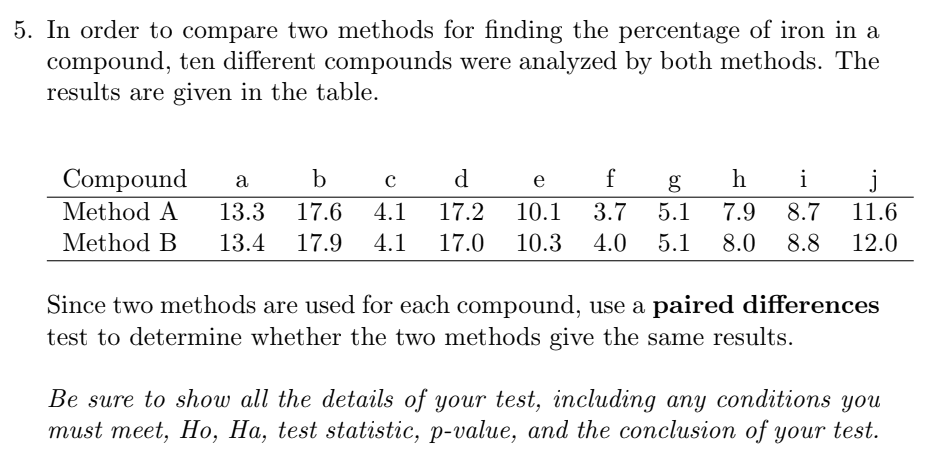

Transcribed Image Text:5. In order to compare two methods for finding the percentage of iron in a
compound, ten different compounds were analyzed by both methods. The
results are given in the table.
Compound
Method A
e
f
g.
i
13.3
17.6
4.1
17.2
10.1
3.7
5.1
7.9
8.7
11.6
Method B
13.4
17.9
4.1
17.0
10.3
4.0
5.1
8.0
8.8
12.0
Since two methods are used for each compound, use a paired differences
test to determine whether the two methods give the same results.
Be sure to show all the details of your test, including any conditions you
тust meet, Hо, На, test statistic, p-value, аnd the conclusion of your test.
Expert Solution
This question has been solved!
Explore an expertly crafted, step-by-step solution for a thorough understanding of key concepts.

Step by stepSolved in 3 steps with 1 images

Knowledge Booster


Learn more about
Need a deep-dive on the concept behind this application? Look no further. Learn more about this topic, statistics and related others by exploring similar questions and additional content below.Similar questions
- hi can you please answer 3 thank youarrow_forwardWhat is the difference between the null hypothesis and the alternative hypothesis when doing a hypothesis test?arrow_forwardIs this what significance means? Statistical significance is very often mentioned in research reports. When asked what it means, a student replies that "results that are statistically significant tell us that they cannot easily be explained by chance variation alone if the hypothesis testing was true. Do you think this statement is essentially correct? Explain your answer.arrow_forward
- Many questions in research can be expressed as two competing statements about the population parameter. These two statements are called the null and the alternative hypotheses. Usually, the researcher hopes the sample evidence will be in favor of the alternative hypothesis, the new theory. It is important to be able to state the theories that are being put to a test. Suppose that 40% of all supermarkets in the US use recyclable plastic bags. We would like to assess if the proportion of supermarkets in Michigan that use recyclable plastic bags is more than the stated rate. For this scenario, write out the hypotheses to be put to the test and define the parameter of interest in context of the problem. H0:Ha: The parameter p represents ___(provide appropriate definition in context)________arrow_forwardA music student wants to know if taking a difficult math course will improve his musical ability. Which of these is the null hypothesis? The student's math scores will improve. There will be no change in math scores. There will be no change in musical ability. The student's musical ability will improve.arrow_forwardThis my third time posting the same question. Because no one answer it straight to me. I already answered the question. Could you please tell me which one of these are not correct. and if so Could you please tell me the correct answer first then explain it. Also could you please highlight the correct answer for each onearrow_forward
- Hello. Could anyone help me on this question? I have tried it four times and only one attempt left. What I am confusing is that some choice are not individual and variables. Like all young children, children who eat snack and cartoon characters. But if i leave them there, it shows me I am wrong. Pls help me on this and explanation would be appreciated. Thanks!arrow_forwardTraveling between two campuses of a university in a city via shuttle bus takes, on average, 28 minutes with a standard deviation of 5 minutes. In a given week, a bus transported passengers 40 times. (a) What is the probability that the average transport time was more than 30 minutes? (b) What is the probability that the average transport time was more than 30 minutes given that it exceeds 20 minutes? (c) What is the probability that the total travelling time is greater than 1180 minutes?arrow_forwardIn performing a hypothesis test, one should decide whether to reject or not reject the null hypothesis before summarizing the results. True or false. Explain.arrow_forward
- A sociologist wants to study what proportion of people have significant relationship problems due to financial stress. A previous study she is aware of estimated it to be 32% but she believes this has increased in modern times. She collects a random sample of 150 people and 63 of them report relationship problems due to financial stress. Conduct an appropriate hypothesis test in questions #22-#25. Compute the Z-score for this hypothesis test and round to two decimal places. z = 1.58 z = 2.06 z = 2.63 z = 0.84arrow_forwardA school psychologist is interested in the efficiency of administration for a new intelligence test for children. In the past, the Wechsler Intelligence Scale for Children (WISC) was used. Thirty sixth grade children are given the new test to see whether the old intelligence test or the new intelligence test is easier to administer. Is this a non-directional or directional hypothesis? How do you know?arrow_forwardCompare statistical testing with legal methods used in a U.S. court setting. Then discuss the following topics in class or consider the topics on your own. Please write a brief but complete essay in which you answer the following questions. (a) In a court setting, the person charged with a crime is initially considered to be innocent. The claim of innocence is maintained until the jury returns with a decision. Explain how the claim of innocence could be taken to be the null hypothesis. Do we assume that the null hypothesis is true throughout the testing procedure?What would the alternate hypothesis be in a court setting?(b) The court claims that a person is innocent if the evidence against the person is not adequate to find him or her guilty. This does not mean, however, that the court has necessarily proved the person to be innocent. It simply means that the evidence against the person was not adequate for the jury to find him or her guilty. How does this situation compare with a…arrow_forward
arrow_back_ios
SEE MORE QUESTIONS
arrow_forward_ios
Recommended textbooks for you
- MATLAB: An Introduction with ApplicationsStatisticsISBN:9781119256830Author:Amos GilatPublisher:John Wiley & Sons Inc
 Probability and Statistics for Engineering and th...StatisticsISBN:9781305251809Author:Jay L. DevorePublisher:Cengage Learning
 Statistics for The Behavioral Sciences (MindTap C...StatisticsISBN:9781305504912Author:Frederick J Gravetter, Larry B. WallnauPublisher:Cengage Learning
  Elementary Statistics: Picturing the World (7th E...StatisticsISBN:9780134683416Author:Ron Larson, Betsy FarberPublisher:PEARSON
 The Basic Practice of StatisticsStatisticsISBN:9781319042578Author:David S. Moore, William I. Notz, Michael A. FlignerPublisher:W. H. Freeman
 Introduction to the Practice of StatisticsStatisticsISBN:9781319013387Author:David S. Moore, George P. McCabe, Bruce A. CraigPublisher:W. H. Freeman
MATLAB: An Introduction with Applications
Statistics
ISBN:9781119256830
Author:Amos Gilat
Publisher:John Wiley & Sons Inc
Probability and Statistics for Engineering and th...
Statistics
ISBN:9781305251809
Author:Jay L. Devore
Publisher:Cengage Learning
Statistics for The Behavioral Sciences (MindTap C...
Statistics
ISBN:9781305504912
Author:Frederick J Gravetter, Larry B. Wallnau
Publisher:Cengage Learning
Elementary Statistics: Picturing the World (7th E...
Statistics
ISBN:9780134683416
Author:Ron Larson, Betsy Farber
Publisher:PEARSON
The Basic Practice of Statistics
Statistics
ISBN:9781319042578
Author:David S. Moore, William I. Notz, Michael A. Fligner
Publisher:W. H. Freeman
Introduction to the Practice of Statistics
Statistics
ISBN:9781319013387
Author:David S. Moore, George P. McCabe, Bruce A. Craig
Publisher:W. H. Freeman