
Principles of Microeconomics
7th Edition
ISBN: 9781305156050
Author: N. Gregory Mankiw
Publisher: Cengage Learning
expand_more
expand_more
format_list_bulleted
Related questions
Concept explainers
Question
Please answer Graph 3 & 4 TPL green line
Note:-
Do not provide handwritten solution. Maintain accuracy and quality in your answer. Take care of plagiarism.
Answer completely.
You will get up vote for sure.
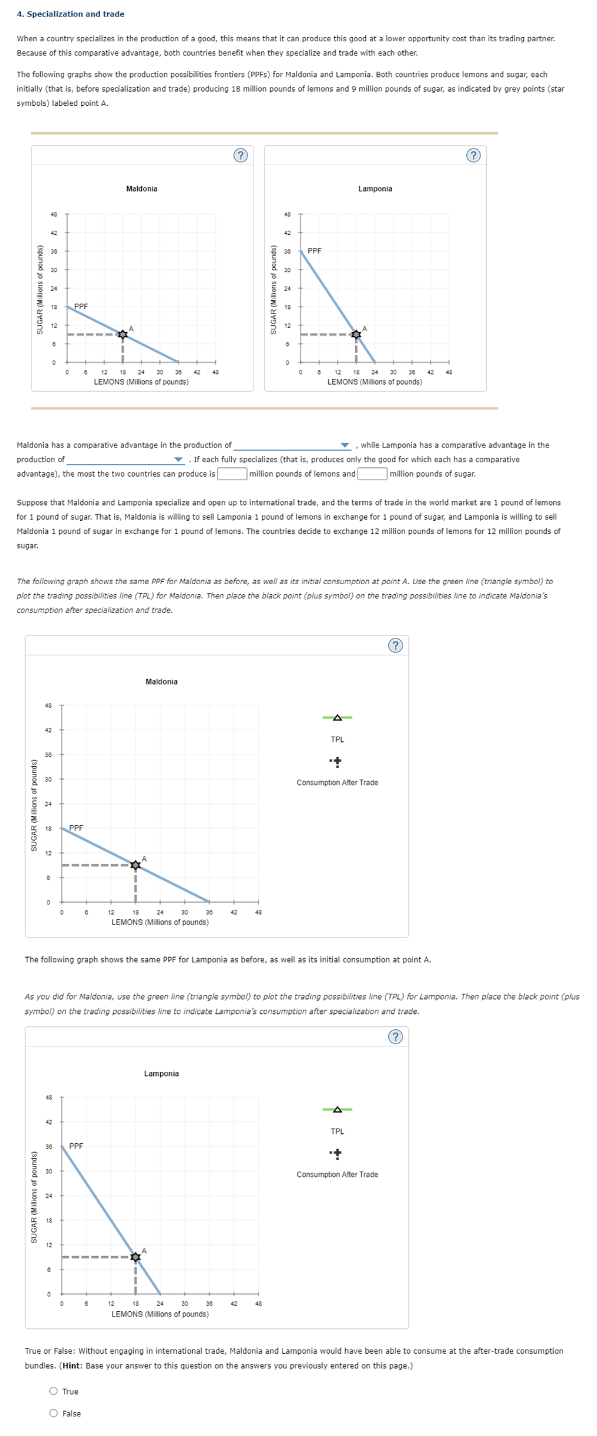

Transcribed Image Text:4. Specialization and trade
When a country specializes in the production of a good, this means that it can produce this good at a lower opportunity cost than its trading partner.
Because of this comparative advantage, both countries benefit when they specialize and trade with each other.
The following graphs show the production possibilities frontiers (PPFS) for Maldonia and Lamponia. Both countries produce lemons and sugar, each
initially (that is, before specialization and trade) producing 18 million pounds of lemons and 9 million pounds of sugar, as indicated by grey points (star
symbols) labeled point A.
SUGAR (Milions of pounds)
10
12
•
42
0
98
30
18
Maldonia has a comparative advantage in the production of
production of
advantage), the most the two countries can produce is
24
12
D
42
0
30
PPF
24
18
30 PPF
12
8
PPF
0
Suppose that Maldonia and Lamponia specialize and open up to international trade, and the terms of trade in the world market are 1 pound of lemons
for 1 pound of sugar. That is, Maldonia is willing to sell Lamponia 1 pound of lemons in exchange for 1 pound of sugar, and Lamponia is willing to sell
Maldonia 1 pound of sugar in exchange for 1 pound of lemons. The countries decide to exchange 12 million pounds of lemons for 12 million pounds of
sugar.
The following graph shows the same PPF for Maldonia as before, as well as its initial consumption at point A. Use the green line (triangle symbol) to
plot the trading possibilities line (TPL) for Maldonia. Then place the black point (plus symbol) on the trading possibilities line to indicate Maldonia's
consumption after specialization and trade.
Maldonia
12 10 24 30 36
LEMONS (Milions of pounds)
0
O True
O False
12
42
Maldonia
18
24
30
LEMONS (Millions of pounds)
40
0 12 18
Lamponia
36
30
LEMONS (Millions of pounds)
SUGAR (Milions of pound
42
48
48
30
42
The following graph shows the same PPF for Lamponia as before, as well as its initial consumption at point A.
30
24
while Lamponia has a comparative advantage in the
If each fully specializes (that is, produces only the good for which each has a comparative
million pounds of lemons and
million pounds of sugar.
As you did for Maldonia, use the green line (triangle symbol) to plot the trading possibilities line (TPL) for Lamponia. Then place the black point (plus
symbol) on the trading possibilities line to indicate Lamponia's consumption after specialization and trade.
(?)
48
10
0
0
PPF
6 12 18 24 30 26 42 40
LEMONS (Millions of pounds)
Lamponia
TPL
++
Consumption After Trade
(?)
TPL
last
(?)
Consumption After Trade
True or False: Without engaging in international trade, Maldonia and Lamponia would have been able to consume at the after-trade consumption
bundles. (Hint: Base your answer to this question on the answers you previously entered on this page.)
Expert Solution
This question has been solved!
Explore an expertly crafted, step-by-step solution for a thorough understanding of key concepts.

This is a popular solution

Trending nowThis is a popular solution!

Step by stepSolved in 4 steps with 2 images

Knowledge Booster


Learn more about
Need a deep-dive on the concept behind this application? Look no further. Learn more about this topic, economics and related others by exploring similar questions and additional content below.Similar questions
- In France it takes one worker to produce one sweater, and one worker to produce one bottle of wine. In Tunisia it takes two workers to produce one sweater, and three workers to produce one bottle of wine. Who has the absolute advantage in production of sweaters? Who has the absolute advantage in the production of wine? How can you tell?arrow_forwardTrue or False: The source of comparative advantage must be natural elements like climate and mineral deposits. Explain.arrow_forwardHow does comparative advantage lead to gains from trade?arrow_forward
- In Japan, one worker can make 5 tons of rubber or 80 radios. In Malaysia, one worker can make 10 tons of rubber or 40 radios. Who has the absolute advantage in the production of rubber or radios? How can you tell? Calculate the opportunity cost of producing 80 additional radios in Japan and in Malaysia. (Your calculation may involve fractions, which is fine,) Which country has a comparative advantage in the production of radios? Calculate the opportunity cost of producing 10 additional tons of rubber in Japan and in Malaysia. Which country has a comparative advantage in producing rubber? In this example, does each country have an absolute advantage and a comparative advantage in the same good? In what product should Japan specialize? In what product should Malaysia specialize?arrow_forwardUnder what conditions does comparative advantage lead to gains from trade?arrow_forwardIn Germany it takes three workers to make one television and four workers to make one video camera. In Poland It takes six workers to make one television and 12 workers to make one video camera. Who has the absolute advantage in the production of televisions? Who has the absolute advantage in the production of video cameras? How can you tell? Calculate the opportunity cost of producing one additional television set in Germany and In Poland. (Your calculation may involve fractions, which Is tine.) Which country has a comparative advantage in the production of televisions? Calculate the opportunity cost of producing one video camera in Germany and in Poland. Which country has a comparative advantage in the production of video cameras? In this example, is absolute advantage the same as comparative advantage, or not? In what product should Germany specialize? In what product should Poland specialize?arrow_forward
arrow_back_ios
arrow_forward_ios
Recommended textbooks for you
- Principles of MicroeconomicsEconomicsISBN:9781305156050Author:N. Gregory MankiwPublisher:Cengage Learning
 Economics (MindTap Course List)EconomicsISBN:9781337617383Author:Roger A. ArnoldPublisher:Cengage Learning

 Principles of Economics 2eEconomicsISBN:9781947172364Author:Steven A. Greenlaw; David ShapiroPublisher:OpenStax
 Essentials of Economics (MindTap Course List)EconomicsISBN:9781337091992Author:N. Gregory MankiwPublisher:Cengage Learning
Principles of Microeconomics
Economics
ISBN:9781305156050
Author:N. Gregory Mankiw
Publisher:Cengage Learning
Economics (MindTap Course List)
Economics
ISBN:9781337617383
Author:Roger A. Arnold
Publisher:Cengage Learning
Principles of Economics 2e
Economics
ISBN:9781947172364
Author:Steven A. Greenlaw; David Shapiro
Publisher:OpenStax
Essentials of Economics (MindTap Course List)
Economics
ISBN:9781337091992
Author:N. Gregory Mankiw
Publisher:Cengage Learning