
ENGR.ECONOMIC ANALYSIS
14th Edition
ISBN: 9780190931919
Author: NEWNAN
Publisher: Oxford University Press
expand_more
expand_more
format_list_bulleted
Related questions
Question
thumb_up100%
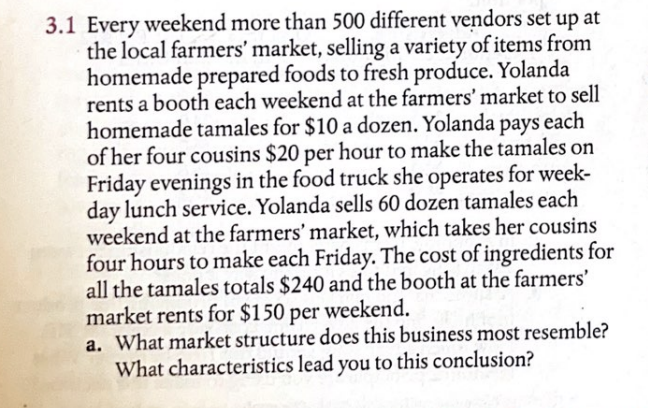

Transcribed Image Text:3.1 Every weekend more than 500 different vendors set up at
the local farmers' market, selling a variety of items from
homemade prepared foods to fresh produce. Yolanda
rents a booth each weekend at the farmers' market to sell
homemade tamales for $10 a dozen. Yolanda pays each
of her four cousins $20 per hour to make the tamales on
Friday evenings in the food truck she operates for week-
day lunch service. Yolanda sells 60 dozen tamales each
weekend at the farmers' market, which takes her cousins
four hours to make each Friday. The cost of ingredients for
all the tamales totals $240 and the booth at the farmers'
market rents for $150 per weekend.
a. What market structure does this business most resemble?
What characteristics lead you to this conclusion?

Transcribed Image Text:b. What would you expect to see happen in this business?
Use the data in the problem to support your conclusions.
c. How would your calculations change if Yolanda were
to develop a weekend lunch business that used the food
truck kitchen's capacity?
hours the structure of cost and
Expert Solution
This question has been solved!
Explore an expertly crafted, step-by-step solution for a thorough understanding of key concepts.

Step by stepSolved in 3 steps

Knowledge Booster


Learn more about
Need a deep-dive on the concept behind this application? Look no further. Learn more about this topic, economics and related others by exploring similar questions and additional content below.Similar questions
- Only typed solutionarrow_forwardJulius owns 100 acres of Florida orange orchards. Currently, he and other orange farmers are experiencing economic losses. As a result, Group of answer choices market supply will decrease and the price of oranges will fall. some farmers with leave the market and the price of oranges will rise. all the farmers should shut down in the long run. some farmers will leave the market and the farmers that stay will decrease their quantity produced.arrow_forward4. Profit maximization in the cost-curve diagram Suppose that the market for candles is a competitive market. The following graph shows the daily cost curves of a firm operating in this market. Hint: After placing the rectangle on the graph, you can select an endpoint to see the coordinates of that point. 40 36 Profit or Loss 32 28 24 20 ATC 16 12 AVC MC 10 12 14 16 18 20 QUANTITY (Thousands of candles per day) In the short run, at a market price of $20 per candle, this firm will choose to produce candles per day. On the preceding graph, use the blue rectangle (circle symbols) to shade the area representing the firm's profit or loss if the market price is $20 and the firm chooses to produce the quantity you already selected. Note: In the following question, enter a positive number, even if it represents a loss. The area of this rectangle indicates that the firm's would be s thousand per day in the short run. PRICE (Dollars per candle)arrow_forward
- 3. Profit maximization in the cost-curve diagram Suppose that the market for frying pans is a competitive market. The following graph shows the daily cost curves of a firm operating in this market Hint: After placing the rectangle on the graph, you can select an endpoint to see the coordinates of that point. 100 90 Profit or Loss 80 70 ATC 60 50 40 30 AVC 20 MC 10 5 10 15 20 25 30 35 40 45 50 QUANTITY (Thousands of pans per day) In the short run, at a market price of $50 per pan, this firm will choose to produce 37,500 pans per day. PRICE (Dollars perpan)arrow_forwardPoornima's Performance Pizza is a small restaurant in San Francisco that sells gluten-free pizzas. Poornima's very tiny kitchen has barely enough room for the three ovens in which her workers bake the pizzas. Poornima signed a lease obligating her to pay the rent for the three ovens for the next year. Because of this, and because Poornima's kitchen cannot fit more than three ovens, Poornima cannot change the number of ovens she uses in her production of pizzas in the short run. However, Poornima's decision regarding how many workers to use can vary from week to week because her workers tend to be students. Each Monday, Poornima lets them know how many workers she needs for each day of the week. In the short run, these workers are inputs, and the ovens are inputs. Poornima's daily production schedule is presented in the following table. Fill in the blanks to complete the Marginal Product of Labor column for each worker. Labor Output Marginal Product of Labor…arrow_forwardThe table below shows the weekly marginal cost (MC) and average total cost (ATC) for Buddies, a purely competitive firm that produces novelty ear buds. Assume the market for novelty ear buds is a competitive market and that the price of ear buds is $6.00 per pair. Buddies Production Costs Quantity MC ATC of Ear Buds ($) ($) 20 1.00 25 2.00 1.20 30 2.46 1.41 35 3.51 1.71 40 4.11 2.01 45 5.43 2.39 50 5.99 2.75 55 8.47 3.27 Instructions: In part a, enter your answer as the closest given whole number. In parts b-d, round your answers to two decimal places. a. If Buddies wants to maximize profits, how many pairs of ear buds should it produce each week? pairs b. At the profit-maximizing quantity, what is the total cost of producing ear buds? 2$ c. If the market price for ear buds is $6 per pair, and Buddies produces the profit-maximizing quantity of ear buds, what will Buddies profit or loss be per week? 2$arrow_forward
- Mmarrow_forwardPaulina sells beef in a competitive market where the price is $8 per pound. Her total revenue and total costs are given in the table below. Quantity of Total revenue Total cost beef (lb.) 0 1 2 3 4 ($) 0 8 16 24 32 ($) 4 8 13 19 27 Profit ($) 0 8 pounds Marginal revenue ($) c. What is the profit-maximizing (or loss-minimizing) quantity? Marginal Marginal cost ($) profit ($) a. Complete the table. Instructions: Enter your answers as a whole number. If you are entering any negative numbers be sure to include a negative sign (-) in front of those numbers. b. At what quantity does marginal revenue equal marginal cost? pounds Aarrow_forward9. Problems and Applications Q9 The market for apple pies in the city of Ectenia is competitive and has the following demand schedule: Each producer in the market has a fixed cost of $6 and the following marginal cost: Quantity Marginal Cost (Dollars) 1 1 2 3 4 5 6 Complete the following table by computing the total cost and average total cost for each quantity produced. Quantity Total Cost Average Total Cost (Ples) (Dollars) (Dollars) 1 2 3 4 3 8 10 12 14 The price of a pie is now $11. At a price of $11, making a profit of O True O Fal pies are sold in the market. Each producer makes True or False: The market is in long-run equilibrium. Suppose that in the long run there is free entry and exit. In the long run, each producer earns a profit of each producer makes pies, so there are The market price is producers operating. pies, so there are At this price, producers in this market, each pies are sold in this market, andarrow_forward
- Only typed answerarrow_forwardI DO NOT NEED THE CHART I ONLY NEED THE QUESTIONS Quantity of Output Total Cost Marginal Cost Average Total Cost 0 $100 1 $120 2 $135 3 $145 4 $160 5 $180 6 $205 7 $240 8 $285 9 $350 10 $440 Approximately where do you think the price will end up in this market over the long run? Explain your answer. Last, instead of assuming a given price, how would you go about finding the equilibrium price if you were given information on market demand? Assume that this market is made up of 10 identical sellers with costs as above, and that market demand can be given as below. It may be useful to construct a column for market supply knowing the cost information per seller and that there are ten identical sellers in the market.arrow_forwardprovide an economic explanation for the provided text below While on vacation, you go to a miniature golf course on a weekday and notice no other customers there while you golf. Why do you think a miniature golf course would stay open during the week when it seems like the revenue from so few customers could not possibly cover the costs of running the golf course? What is an example of another business that stays open even when it's slow, and their revenue does not seem like it could cover their costs? make sure to use concepts from either of the following topics (minimum of two from the list provided rest may be from own knowledge): externalities, public goods and common resources, understanding costs, business behaviour and businesses in competitive markets.arrow_forward
arrow_back_ios
SEE MORE QUESTIONS
arrow_forward_ios
Recommended textbooks for you
 Principles of Economics (12th Edition)EconomicsISBN:9780134078779Author:Karl E. Case, Ray C. Fair, Sharon E. OsterPublisher:PEARSON
 Engineering Economy (17th Edition)EconomicsISBN:9780134870069Author:William G. Sullivan, Elin M. Wicks, C. Patrick KoellingPublisher:PEARSON
 Principles of Economics (MindTap Course List)EconomicsISBN:9781305585126Author:N. Gregory MankiwPublisher:Cengage Learning
 Managerial Economics: A Problem Solving ApproachEconomicsISBN:9781337106665Author:Luke M. Froeb, Brian T. McCann, Michael R. Ward, Mike ShorPublisher:Cengage Learning
 Managerial Economics & Business Strategy (Mcgraw-...EconomicsISBN:9781259290619Author:Michael Baye, Jeff PrincePublisher:McGraw-Hill Education
Principles of Economics (12th Edition)
Economics
ISBN:9780134078779
Author:Karl E. Case, Ray C. Fair, Sharon E. Oster
Publisher:PEARSON
Engineering Economy (17th Edition)
Economics
ISBN:9780134870069
Author:William G. Sullivan, Elin M. Wicks, C. Patrick Koelling
Publisher:PEARSON
Principles of Economics (MindTap Course List)
Economics
ISBN:9781305585126
Author:N. Gregory Mankiw
Publisher:Cengage Learning
Managerial Economics: A Problem Solving Approach
Economics
ISBN:9781337106665
Author:Luke M. Froeb, Brian T. McCann, Michael R. Ward, Mike Shor
Publisher:Cengage Learning
Managerial Economics & Business Strategy (Mcgraw-...
Economics
ISBN:9781259290619
Author:Michael Baye, Jeff Prince
Publisher:McGraw-Hill Education