MATLAB: An Introduction with Applications
6th Edition
ISBN: 9781119256830
Author: Amos Gilat
Publisher: John Wiley & Sons Inc
expand_more
expand_more
format_list_bulleted
Question

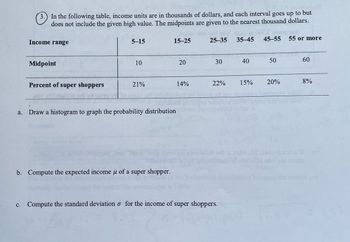
Transcribed Image Text:In the following table, income units are in thousands of dollars, and each interval goes up to but
does not include the given high value. The midpoints are given to the nearest thousand dollars.
Income range
5-15
15-25
25-35 35-45
45-55 55 or more
Midpoint
10
20
30
40
50
60
Percent of super shoppers
21%
14%
22%
15%
20%
8%
a.
Draw a histogram to graph the probability distribution
b. Compute the expected income μ of a super shopper.
c. Compute the standard deviation σ for the income of super shoppers.
Expert Solution
This question has been solved!
Explore an expertly crafted, step-by-step solution for a thorough understanding of key concepts.
Step by stepSolved in 3 steps with 21 images

Knowledge Booster
Similar questions
- The correlation between midterm and final grades for 300 students is 0.620. If 5 points are added to each midterm grade, the new r will be: a. 0.124 b. 0.57 c. 0.62 d. 0.744arrow_forwardA statistics class has 136 students. The professor records how much money (in dollars) each student carries in his or her pocket during the first class. The histogram shows the data that were collected. Frequency 60 50 40 30 20 10 0 0 10 20 30 40 50 60 70 80 90 100 110 The percentage of students having less than $10 in their pockets is closest to 30% 35% 70% 60% 50%arrow_forwardThe data represent the time, in minutes, spent reading a political blog in a day. Construct a frequency distribution using 5 classes. In the table, include the midpoints, relative frequencies, and cumulative frequencies. Which class has the greatest frequency and which has the least frequency? Complete the table, starting with the lowest class limit. (Simplify your answers.) Class 0-0 Frequency Midpoint 150 187 Relative Frequency 10 7 19 0 1338 1 0 10 5 0 3180 11 Cumulative Frequencyarrow_forward
- A County Board of Supervisors has appointed an urban planning committee to evaluate proposed community development projects. The committee is analyzing, among other things, data on household incomes in two cities within the county. They have collected data on the income of 77 households in each of the two cities. The histograms below show the distributions of the two sets of incomes (in thousands of dollars). Each histogram shows household income on the horizontal axis and number of households on the vertical axis. The means and standard deviations for the data sets are also given. City A City B 25+ 20+ 15+ 10+ 5- ← 10 20 30 40 50 60 70 80 90 100 City A mean: 73.96 thousand dollars City A standard deviation: 20.30 thousand dollars Explanation 25- 20- 15- 104 5+ 10 (a) Identify the data set for which it is appropriate to use the Empirical Rule. It is appropriate to use the Empirical Rule for the (Choose one) ▼ data set. 20 30 The committee wants to use the Empirical Rule to make some…arrow_forwardA survey of 30 people was conducted about how many siblings they had. A graph was created that showed the percentage of the survey group, which had each number of siblings. The "frequency" column in the table shows the number of responses that having a certain number of siblings received. Using appropriate and precise statistical terminology, describe the distribution and provide an explanation for the distribution being a certain way.arrow_forwardA is a table that displays the of the entries in a data set. frequency distribution frequencies stem and leaf plot relative frequencies probability distribution cumulative frequencies histogram cumulative relative frequenciesarrow_forward
arrow_back_ios
arrow_forward_ios
Recommended textbooks for you
 MATLAB: An Introduction with ApplicationsStatisticsISBN:9781119256830Author:Amos GilatPublisher:John Wiley & Sons Inc
 Probability and Statistics for Engineering and th...StatisticsISBN:9781305251809Author:Jay L. DevorePublisher:Cengage Learning
 Statistics for The Behavioral Sciences (MindTap C...StatisticsISBN:9781305504912Author:Frederick J Gravetter, Larry B. WallnauPublisher:Cengage Learning
 Elementary Statistics: Picturing the World (7th E...StatisticsISBN:9780134683416Author:Ron Larson, Betsy FarberPublisher:PEARSON
 The Basic Practice of StatisticsStatisticsISBN:9781319042578Author:David S. Moore, William I. Notz, Michael A. FlignerPublisher:W. H. Freeman
 Introduction to the Practice of StatisticsStatisticsISBN:9781319013387Author:David S. Moore, George P. McCabe, Bruce A. CraigPublisher:W. H. Freeman

MATLAB: An Introduction with Applications
Statistics
ISBN:9781119256830
Author:Amos Gilat
Publisher:John Wiley & Sons Inc

Probability and Statistics for Engineering and th...
Statistics
ISBN:9781305251809
Author:Jay L. Devore
Publisher:Cengage Learning

Statistics for The Behavioral Sciences (MindTap C...
Statistics
ISBN:9781305504912
Author:Frederick J Gravetter, Larry B. Wallnau
Publisher:Cengage Learning

Elementary Statistics: Picturing the World (7th E...
Statistics
ISBN:9780134683416
Author:Ron Larson, Betsy Farber
Publisher:PEARSON

The Basic Practice of Statistics
Statistics
ISBN:9781319042578
Author:David S. Moore, William I. Notz, Michael A. Fligner
Publisher:W. H. Freeman

Introduction to the Practice of Statistics
Statistics
ISBN:9781319013387
Author:David S. Moore, George P. McCabe, Bruce A. Craig
Publisher:W. H. Freeman